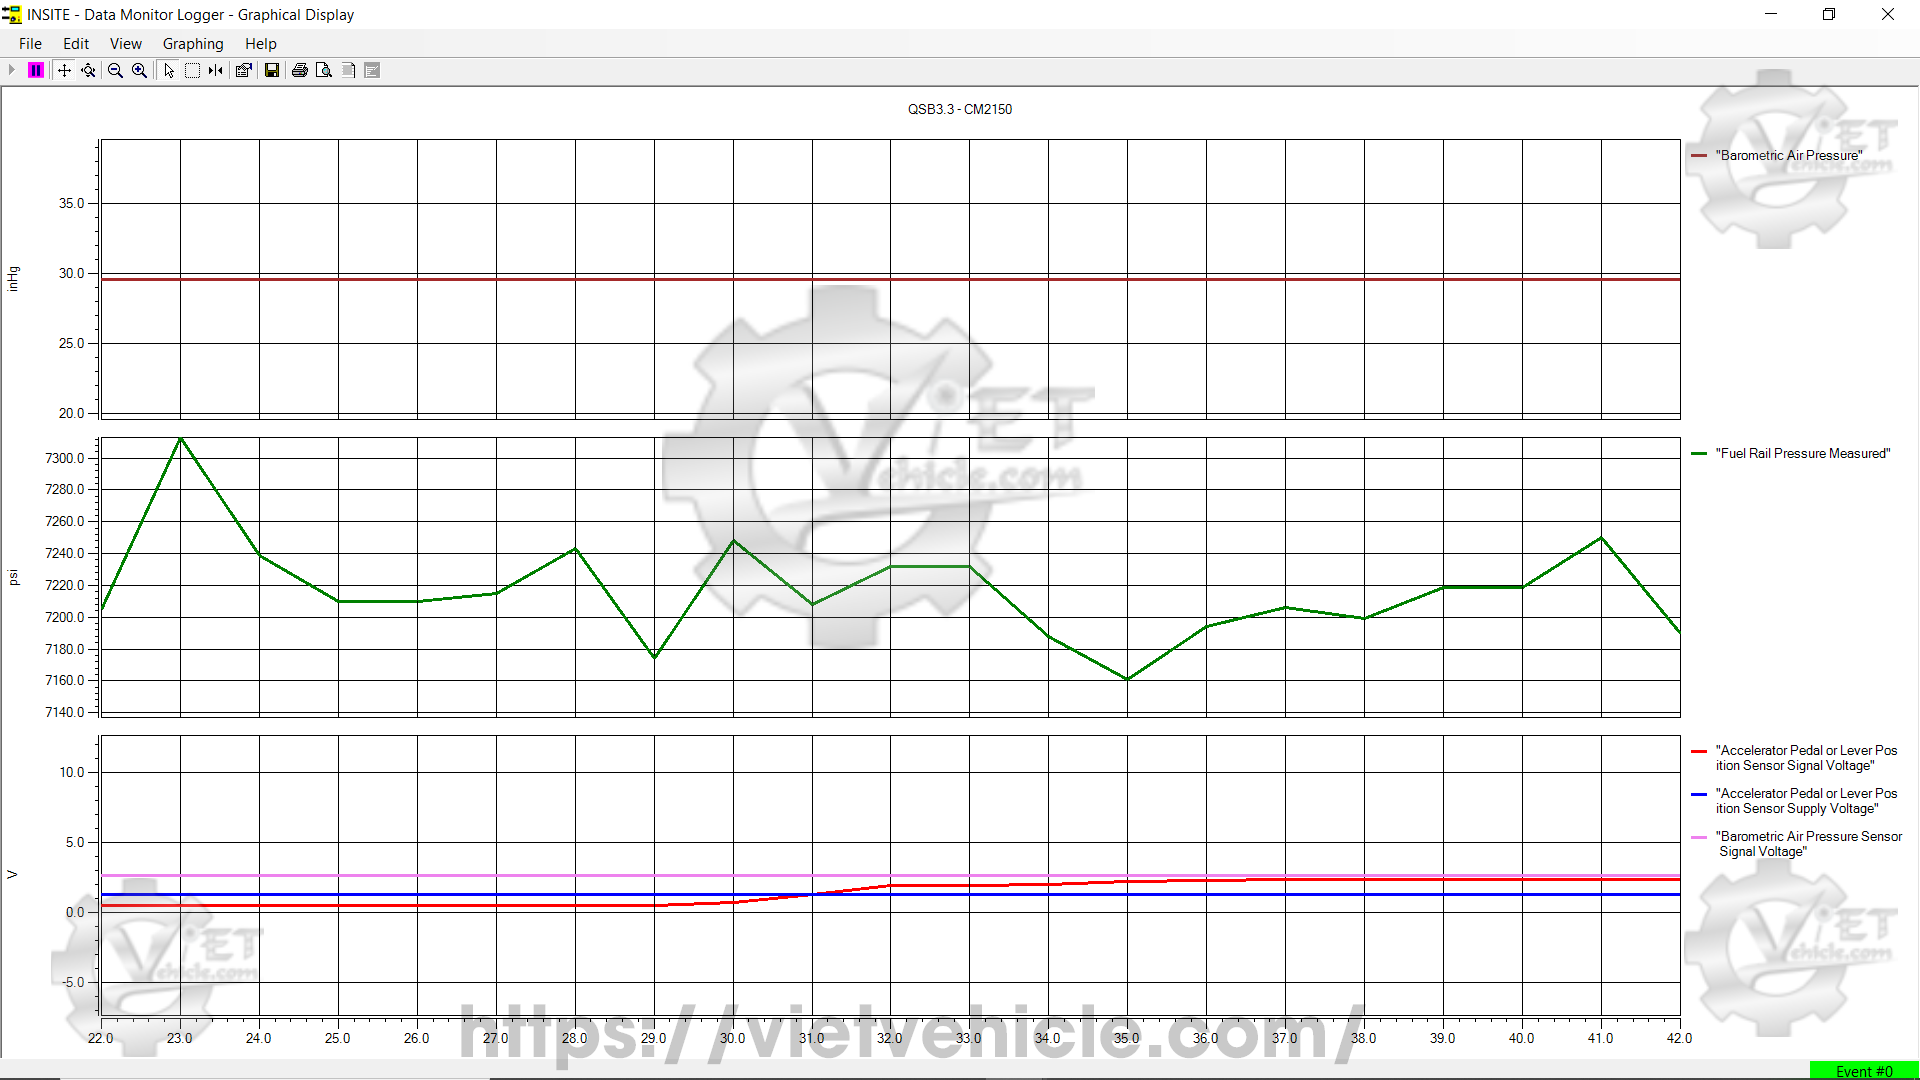
Figure 1.1 – Graphical Display (QSB3.3-CM2150)
About
Graphical Monitoring allows users to display, log, print, and save data for up to six parameters in a graphical format. It provides a visual representation of multiple parameters plotted on a graph.
The X-axis (horizontal) represents the sample rate, while the Y-axis (vertical) displays parameter values. The scale automatically adjusts based on data variations. When multiple parameters are selected, each is labeled on the right side of the graph, with corresponding units on the left. Each data point reflects a recorded value at a specific sample point.
Users can add or remove parameters during monitoring and save, export, or import data from the graph.
Special Instructions
Open and connect Cummins INSITE Software. [Read More: How to Connect CUMMINS Engines using Cummins INSITE Software]
Select Data Monitor/Logger from the Viewbar. [Read More: Data Monitor/Logger on Cummins INSITE Software (CUMMINS Engines)]
Start graphical monitoring using one of the following methods:
From the menu bar, click Tools > Data Monitor/Logger > Start Graphical Monitoring.
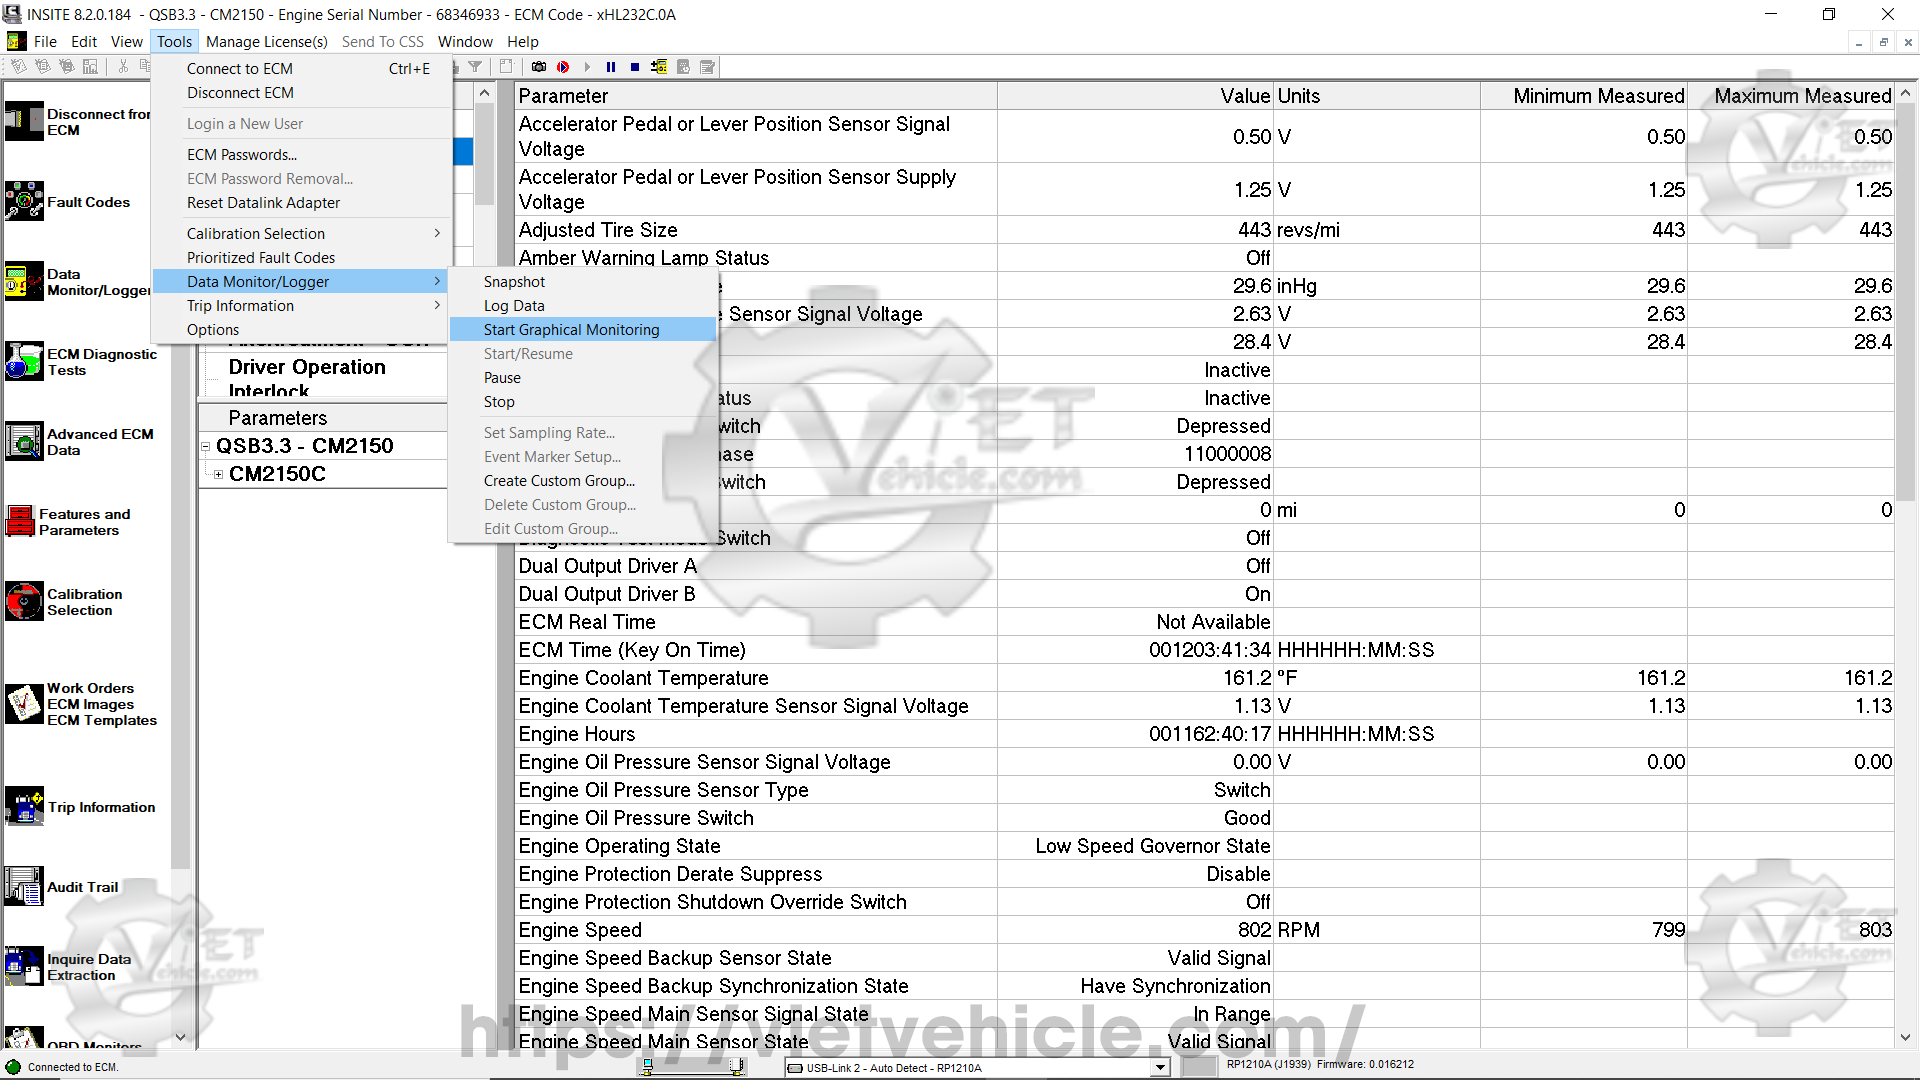
Figure 1.2 – Start Graphical Monitoring
Click the Start Graphical Monitoring button from the toolbar.
Right-click on a parameter from the Parameter Groups or Individual Parameters list and select Start Graphical Monitoring.
From the Available Groups list, select parameters to monitor, log, and set the sampling rate. Refer to the Selecting Parameters section for details.
Click OK to graph selected parameters or Cancel to return to Data Monitor/Logger.
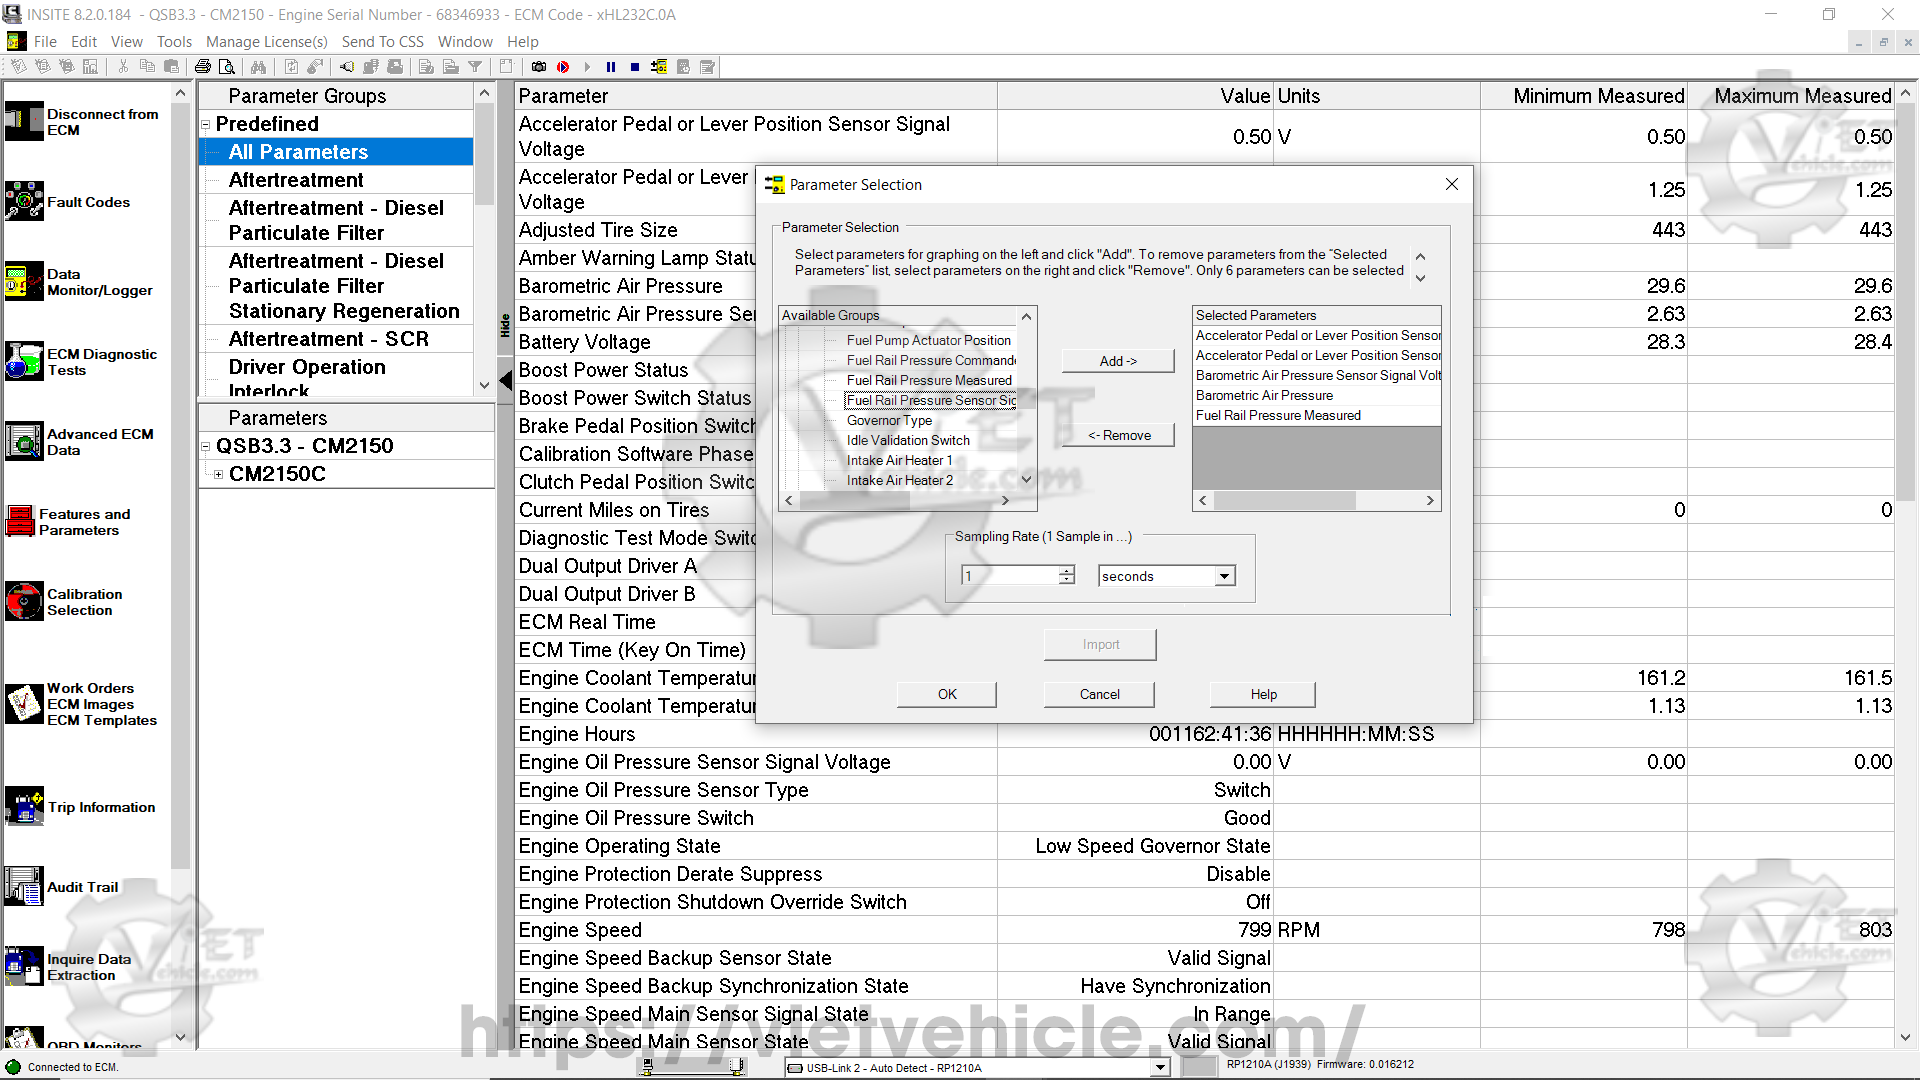
Figure 1.3 – Parameter Selection
Click Start Graphical Monitoring to begin monitoring data.
Selecting Parameters (Refer to Figure 1.3)
(a) Adding Parameters
Under Available Groups, click the expand icon to display selectable parameters.
Select a parameter and click Add or double-click it to move it to the Selected Parameters list. A maximum of six parameters can be selected.
(b) Removing Parameters
Select a parameter from the Selected Parameters list and click Remove or double-click to delete it.
(c) Importing from a File
Graphical Monitoring allows users to import and view saved graphs.
Click Import in the Parameter Selection window.
In the Open Log File window, browse to a log file (.elf extension).
Click Open to view the graph or Cancel to return.
Scroll left (<<) or right (>>) to navigate the graph.
Setting the Sampling Rate (Refer to Figure 1.3)
From the Parameter Selection window:
Enter the desired sampling rate (zero is invalid).
Select milliseconds, seconds, minutes, or hours as units.
Graphing Menu
Start Graphing – Begins graphical monitoring.
Stop Graphing – Stops graphical monitoring.
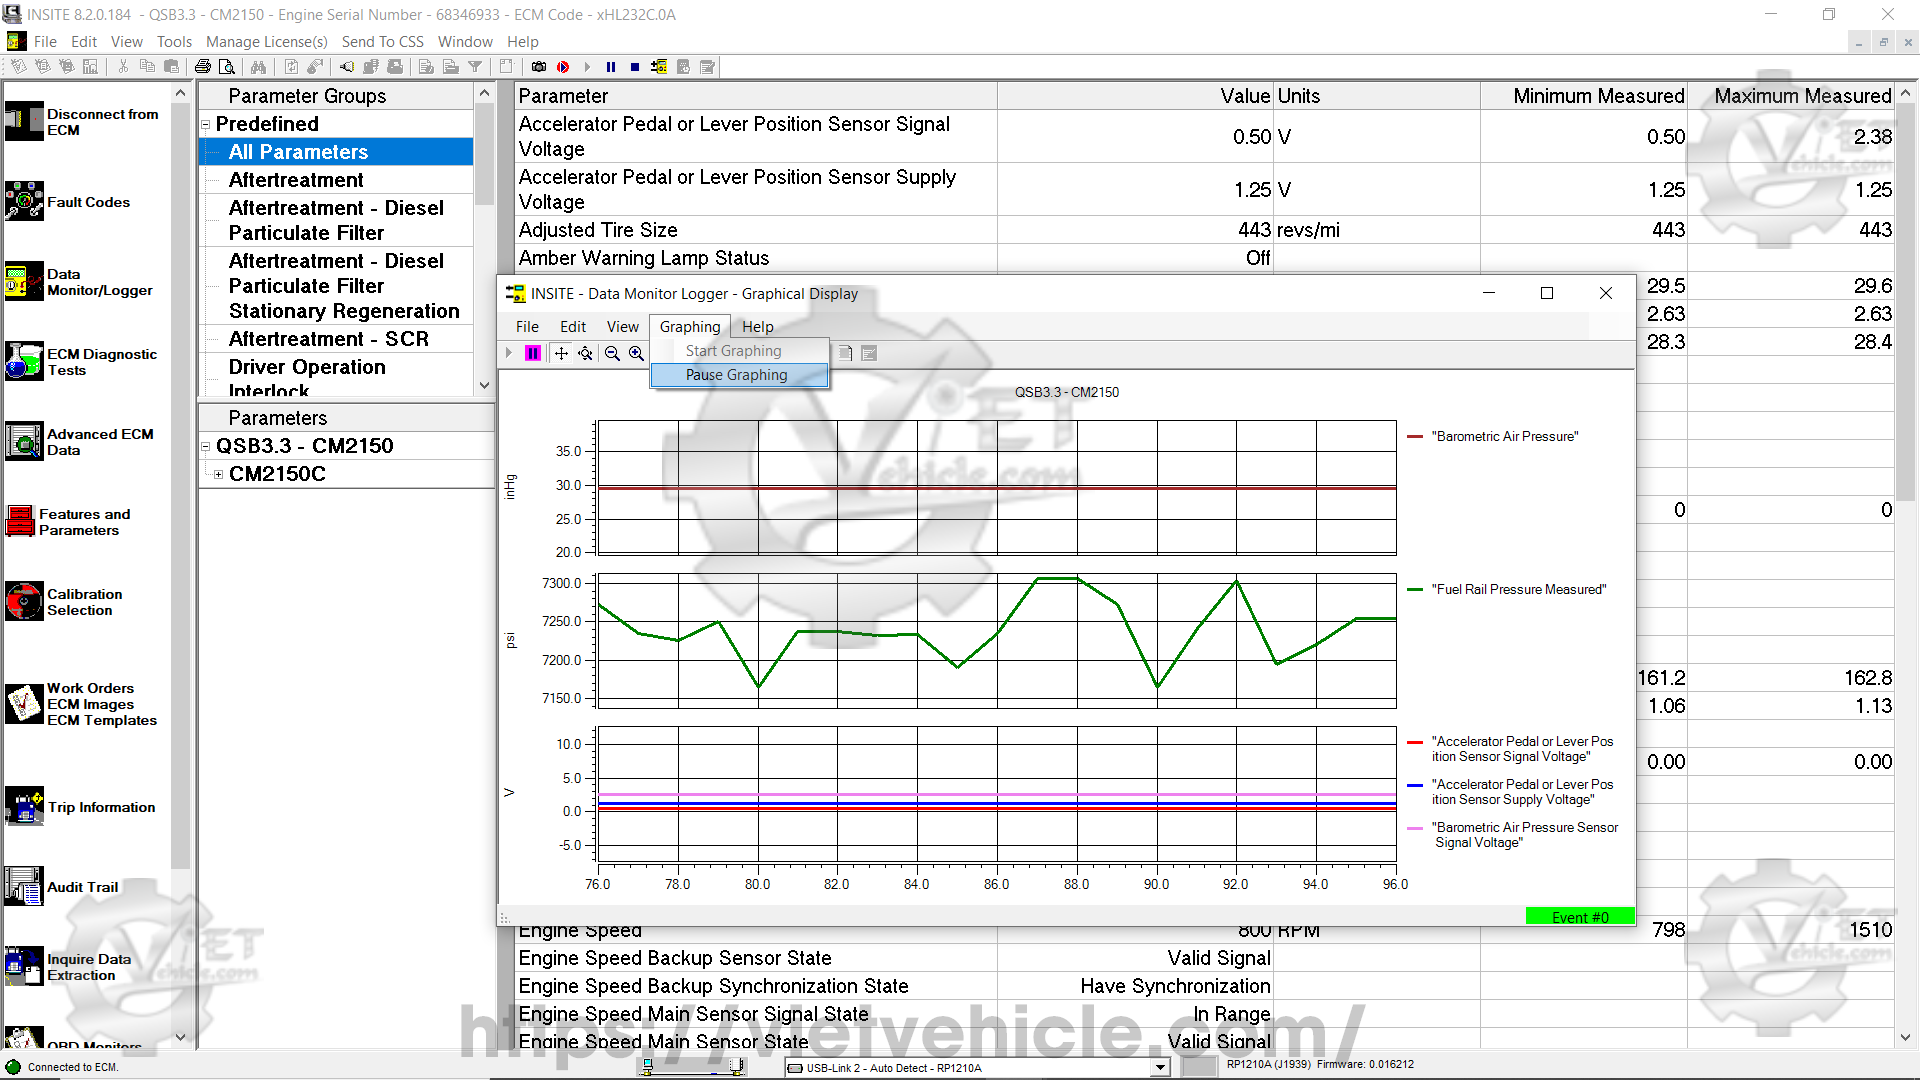
Figure 1.4 – Graphing Menu
Toolbar Menu
Add/Remove Parameters – Modify parameters while graphing. A prompt appears asking if the existing graph should be saved.
Axis Scroll – Scroll along the X (horizontal) or Y (vertical) axes.
Axis Zoom – Zoom in or out along the X or Y axes.
Data Cursor – Displays the data point value. A vertical line appears in the graph’s center and can be moved using the mouse.
Page Setup – Configure paper size, orientation, margins, and printer settings.
Pause – Temporarily halt graphical monitoring.
Play/Reset View – Resume or reset graphical monitoring.
Print – Print the displayed graph.
Print Preview – Preview the graph before printing.
Save As Picture – Save the graph as an image.
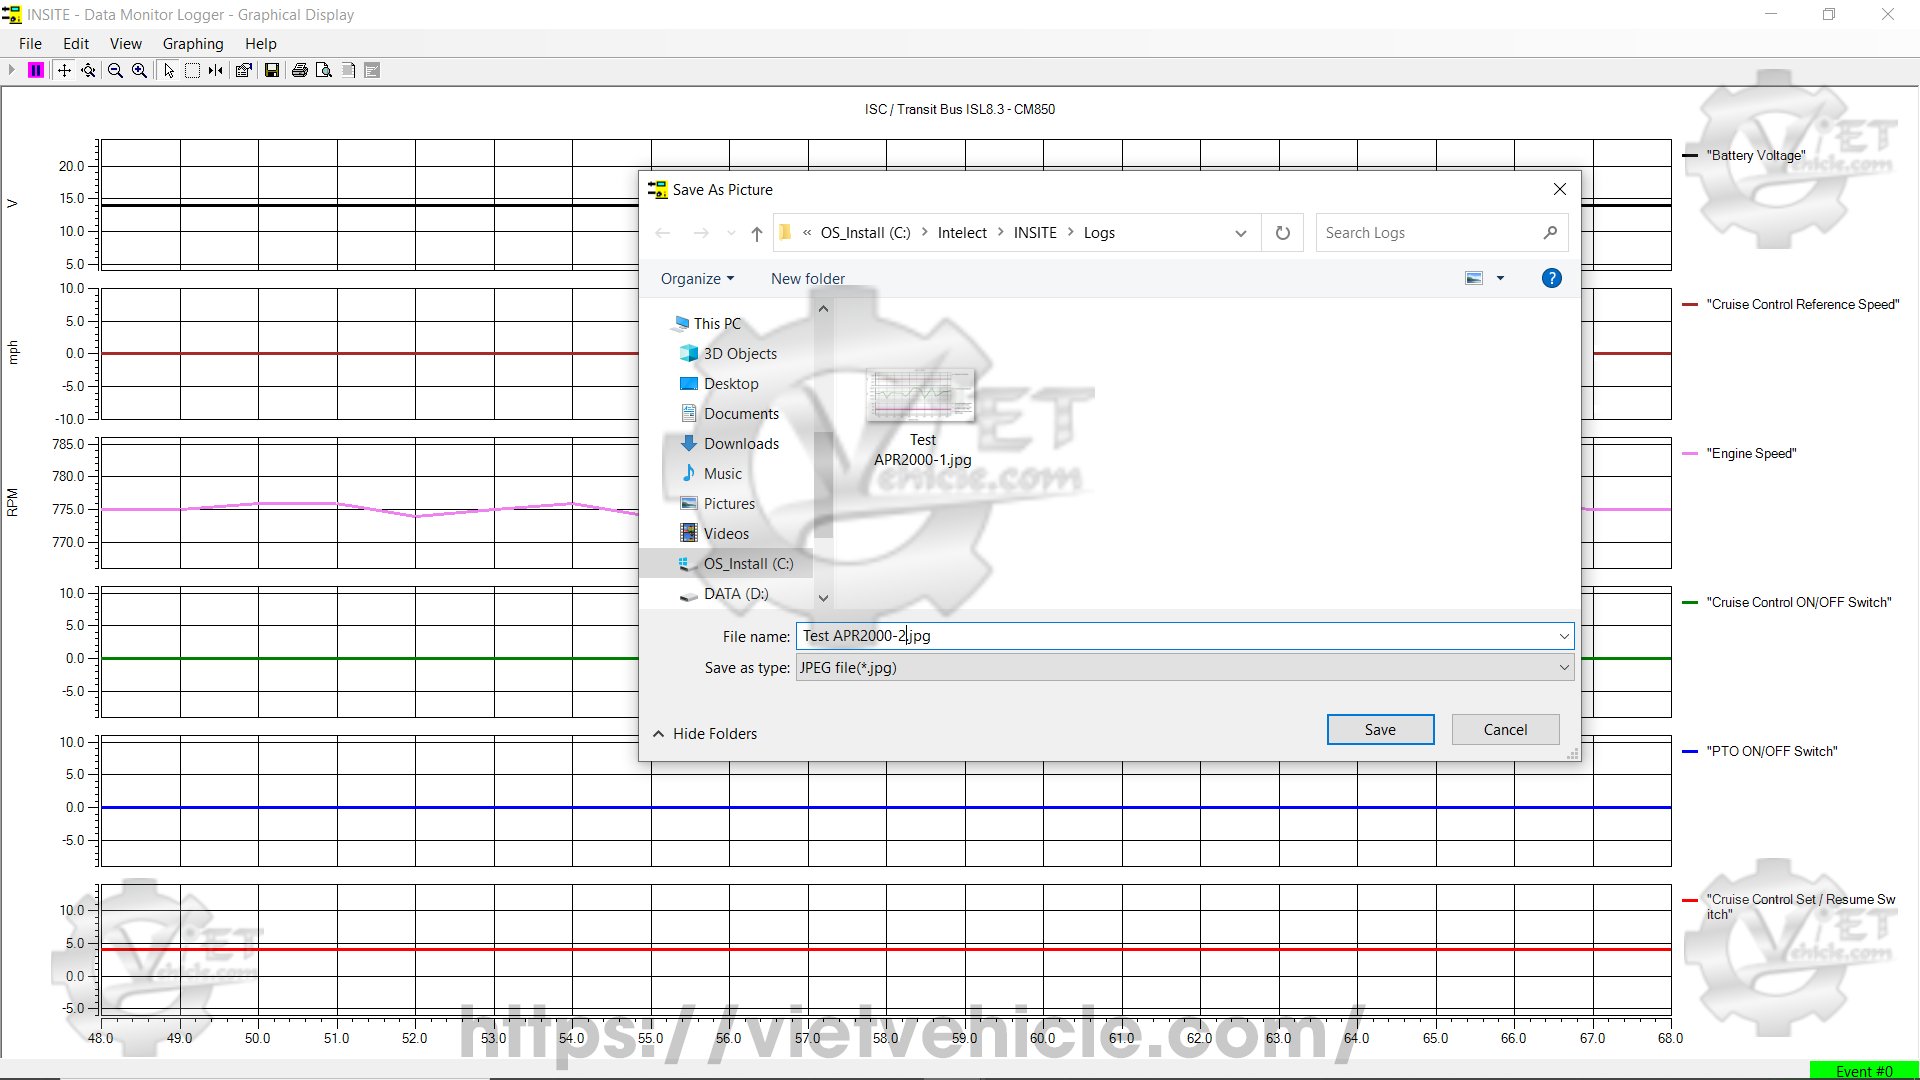
Figure 1.5 – Save As Picture
Saving and Exporting Files
Save/Export File – Save logged data.
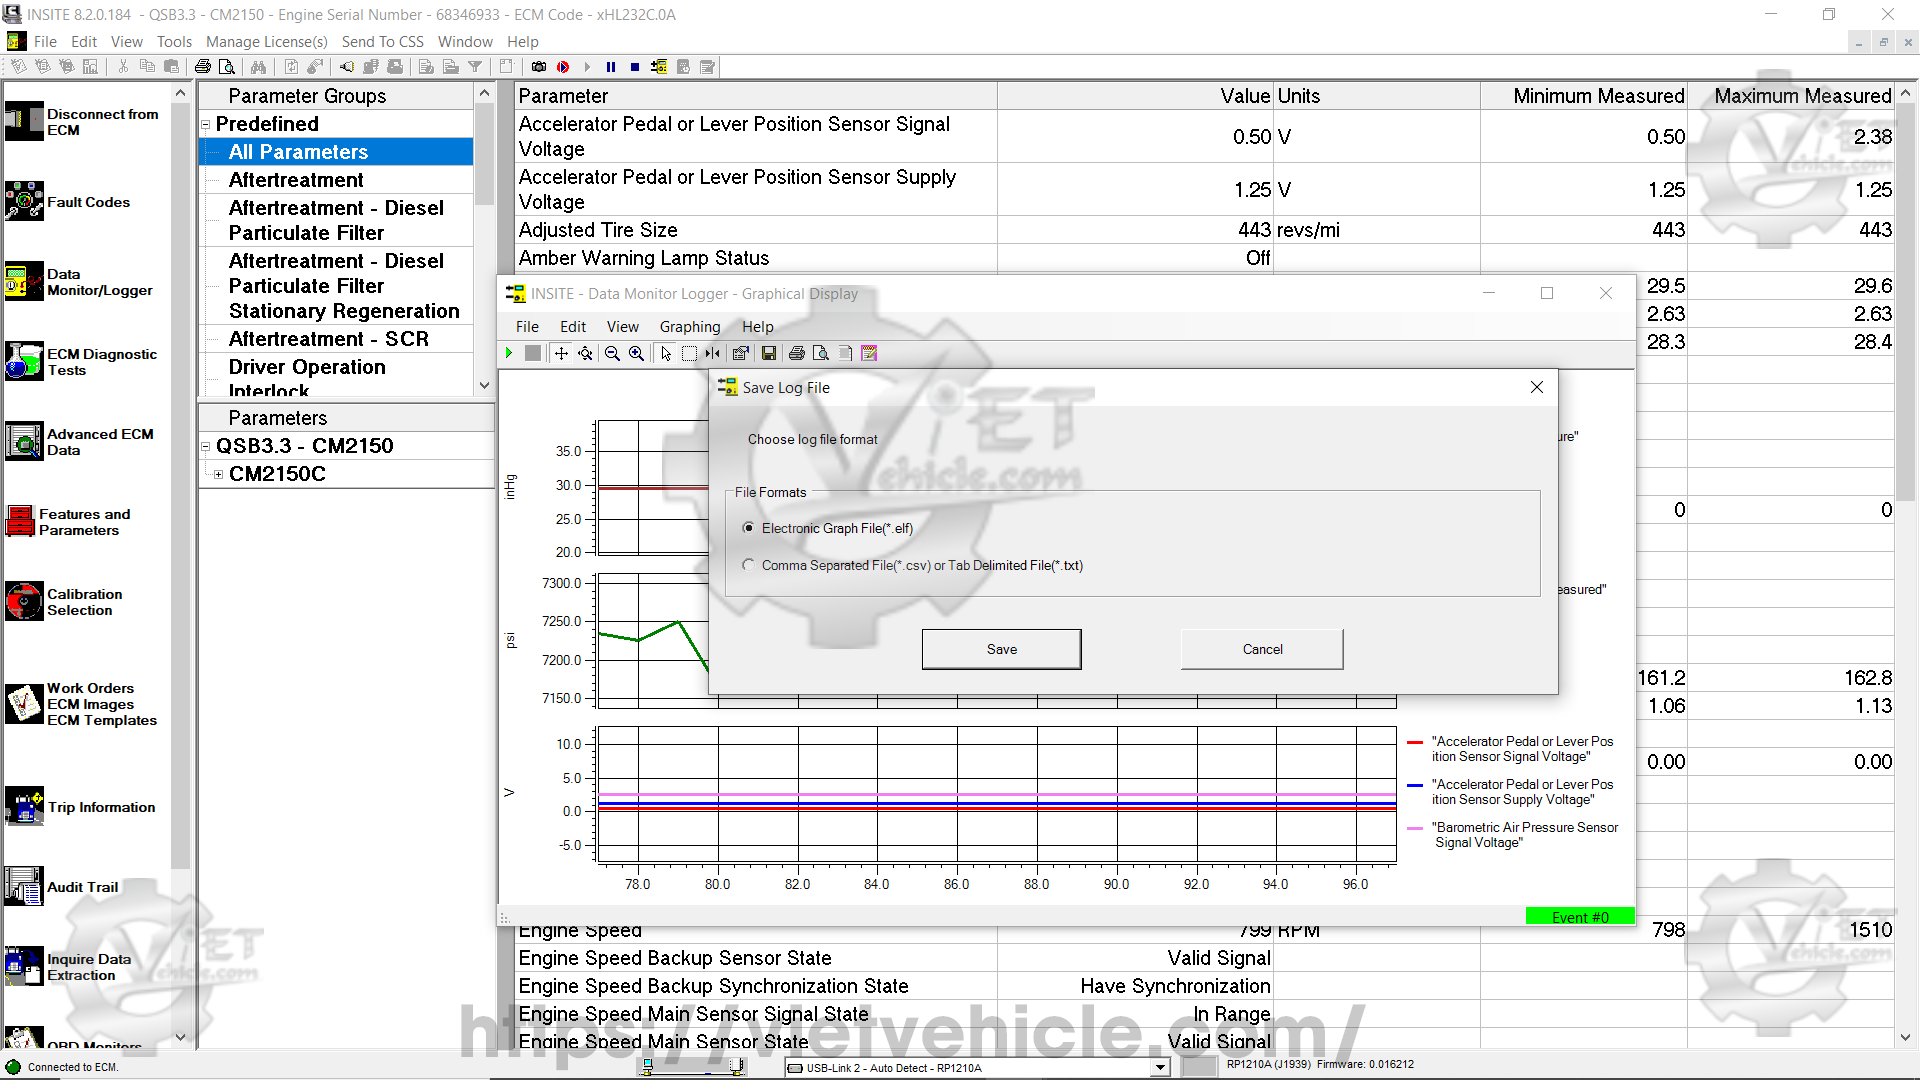
Figure 1.6 – Save Log File
In the Save Log File window:
Choose a file format and click Save.
Supported formats: .elf (Electronic Log File for import/viewing), .csv (Comma-Separated Values), .txt (Tab-Delimited Text).
Click Save after selecting the format.
In the Export Log File window:
Use the default file name or enter a custom one.
Click Save to store the data or Cancel to return to Graphical Display.
Contact Us
Whatsapp: +84.858.966.333
Facebook: VIETVehicle Remote Delete Service
YouTube: VIETVehicle – ECM Delete Tuning
Tiktok: VIETVehicle.com
Website: VIETVehicle.com


