Diagnostic Instrumentation
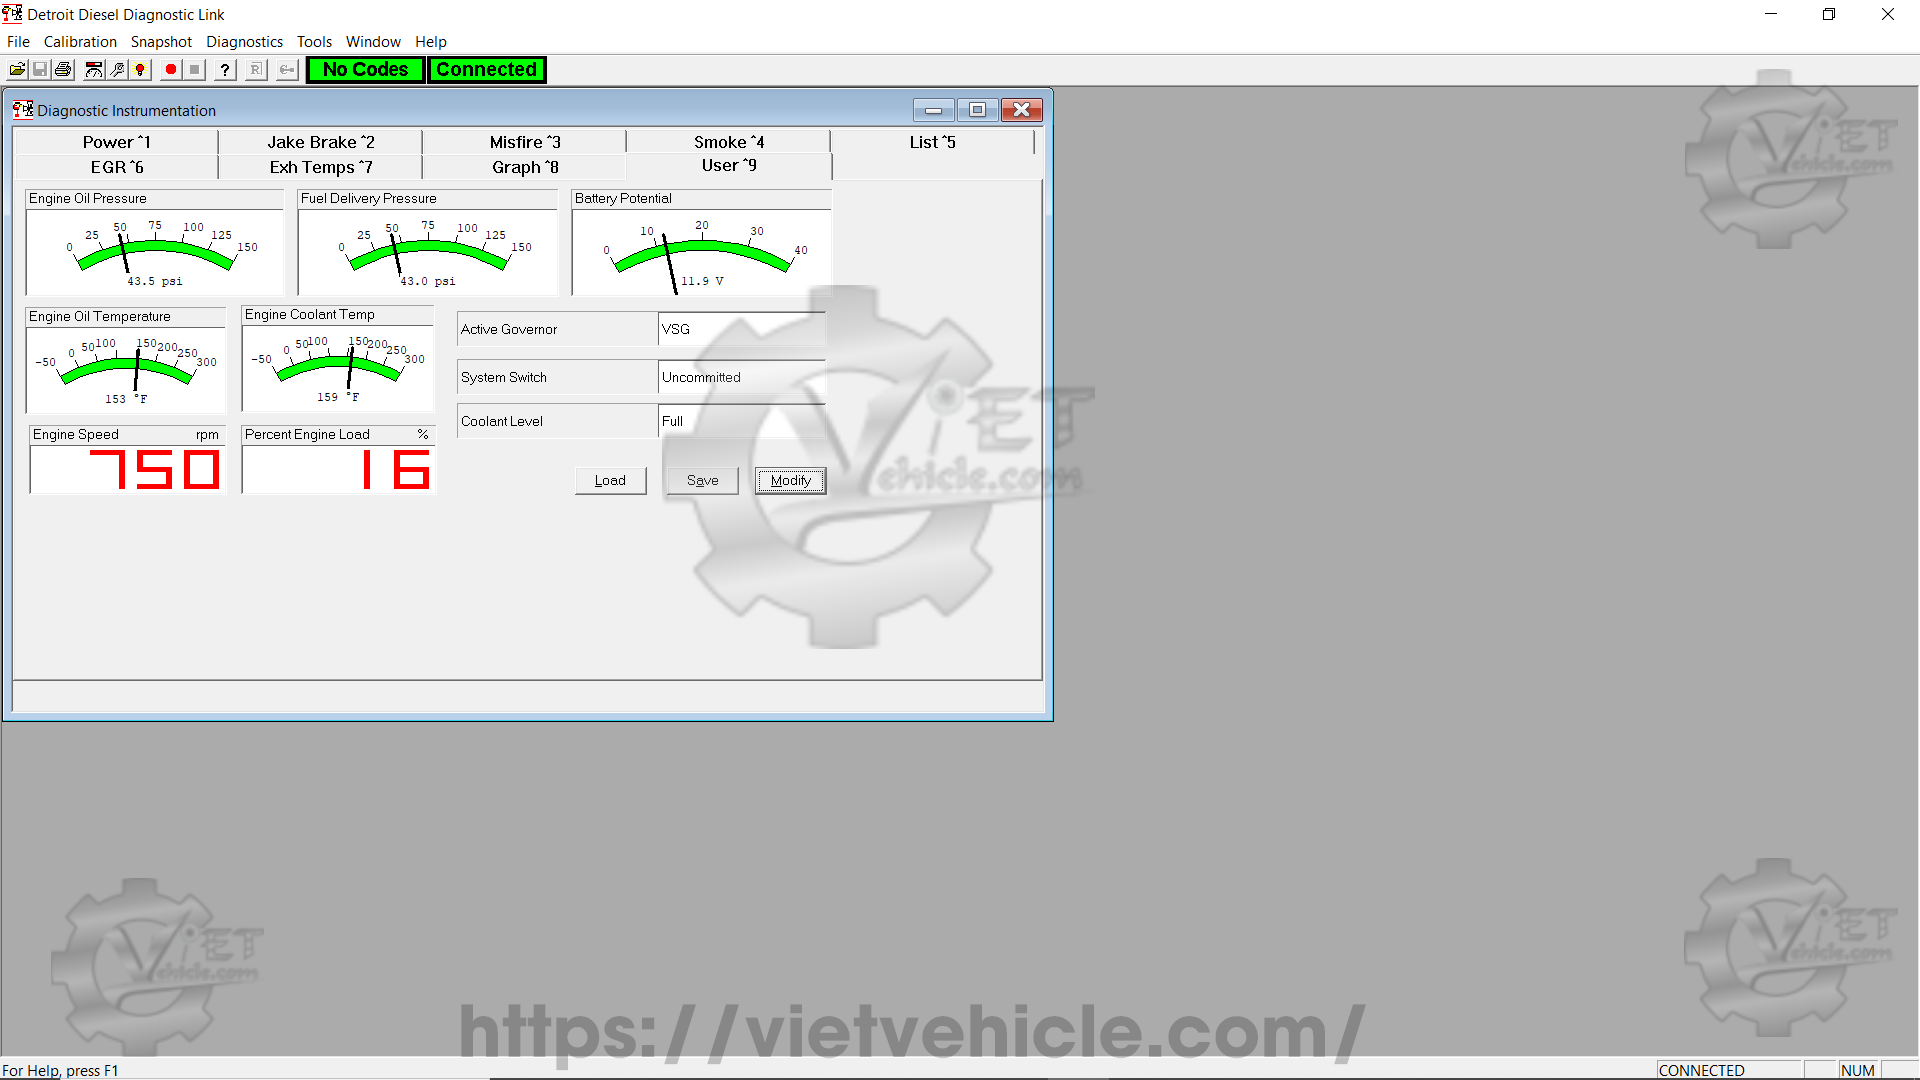
Figure 1.1 – Diagnostic Instrumentation (List 5)
The instruments in the Instrumentation Window are grouped together into tabs. You can customize the grouping by selecting Normal Instrumentation or Diagnostic Instrumentation from the Diagnostics menu.
To Open Diagnostic Instrumentation
- Open Detroit Diesel Diagnostic Link (DDDL v6.46) and connect to the DETROIT Engine (DDEC).
- Open the Diagnostics Menu and select Diagnostic Instrumentation.
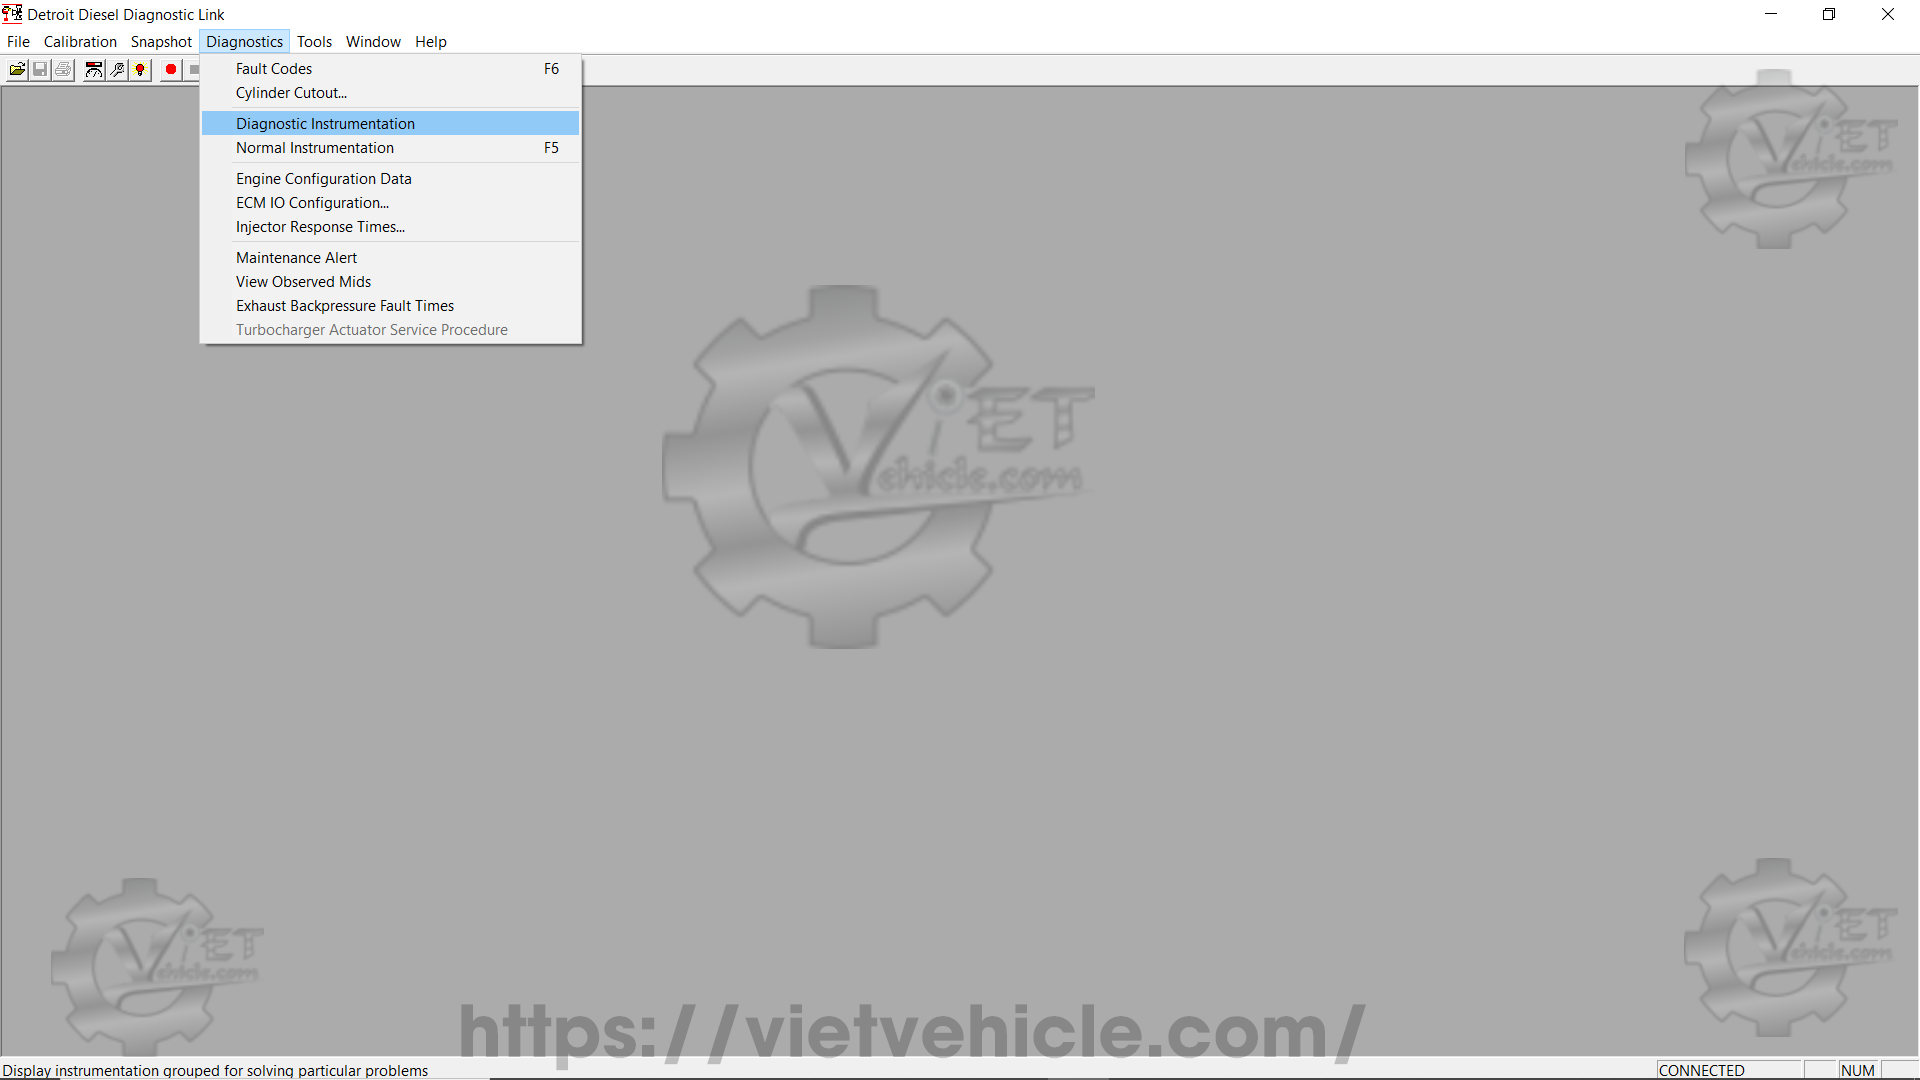
Figure 1.2 – Diagnostics (Diagnostic instrumentation)
- When the command is selected, a radio button will appear next to it in the menu. The window will display real-time data measurements from the ECM connected to your PC.
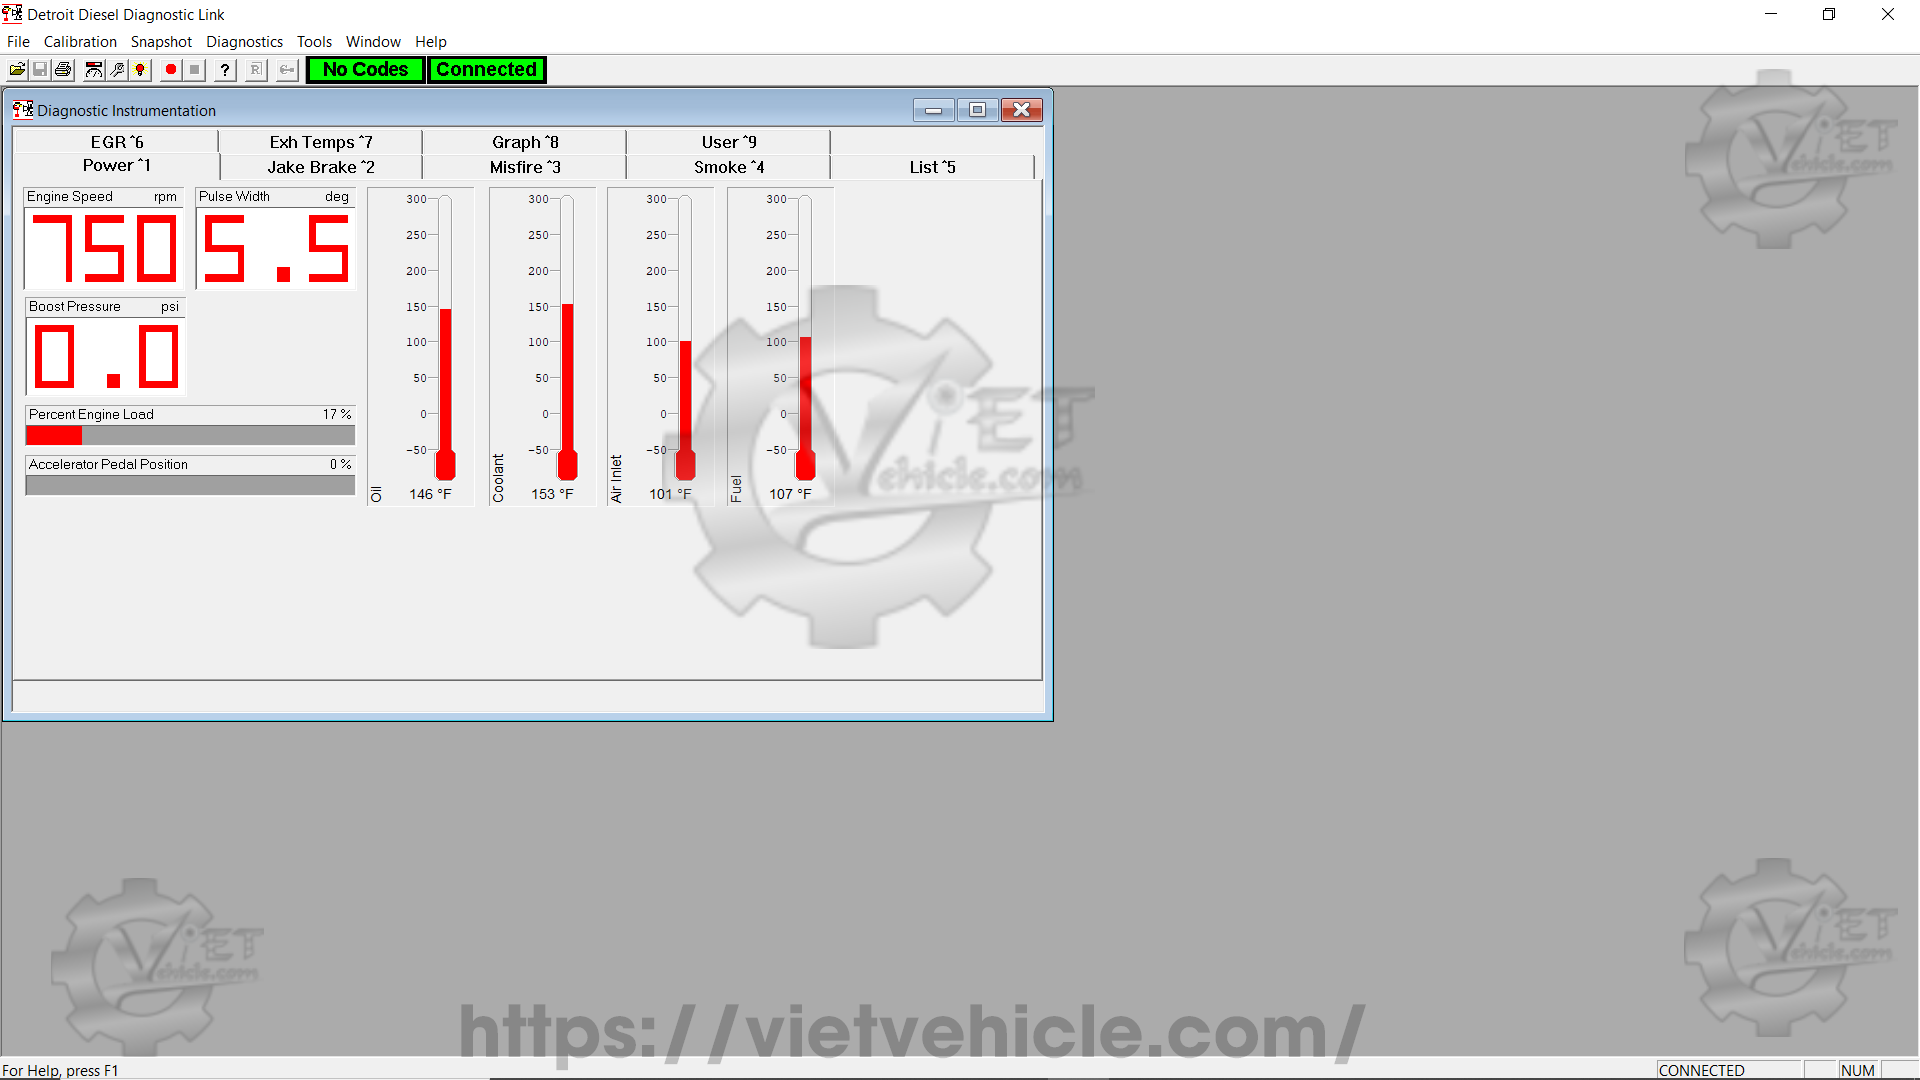
Figure 1.3 – Diagnostic Instrumentation (Power1)
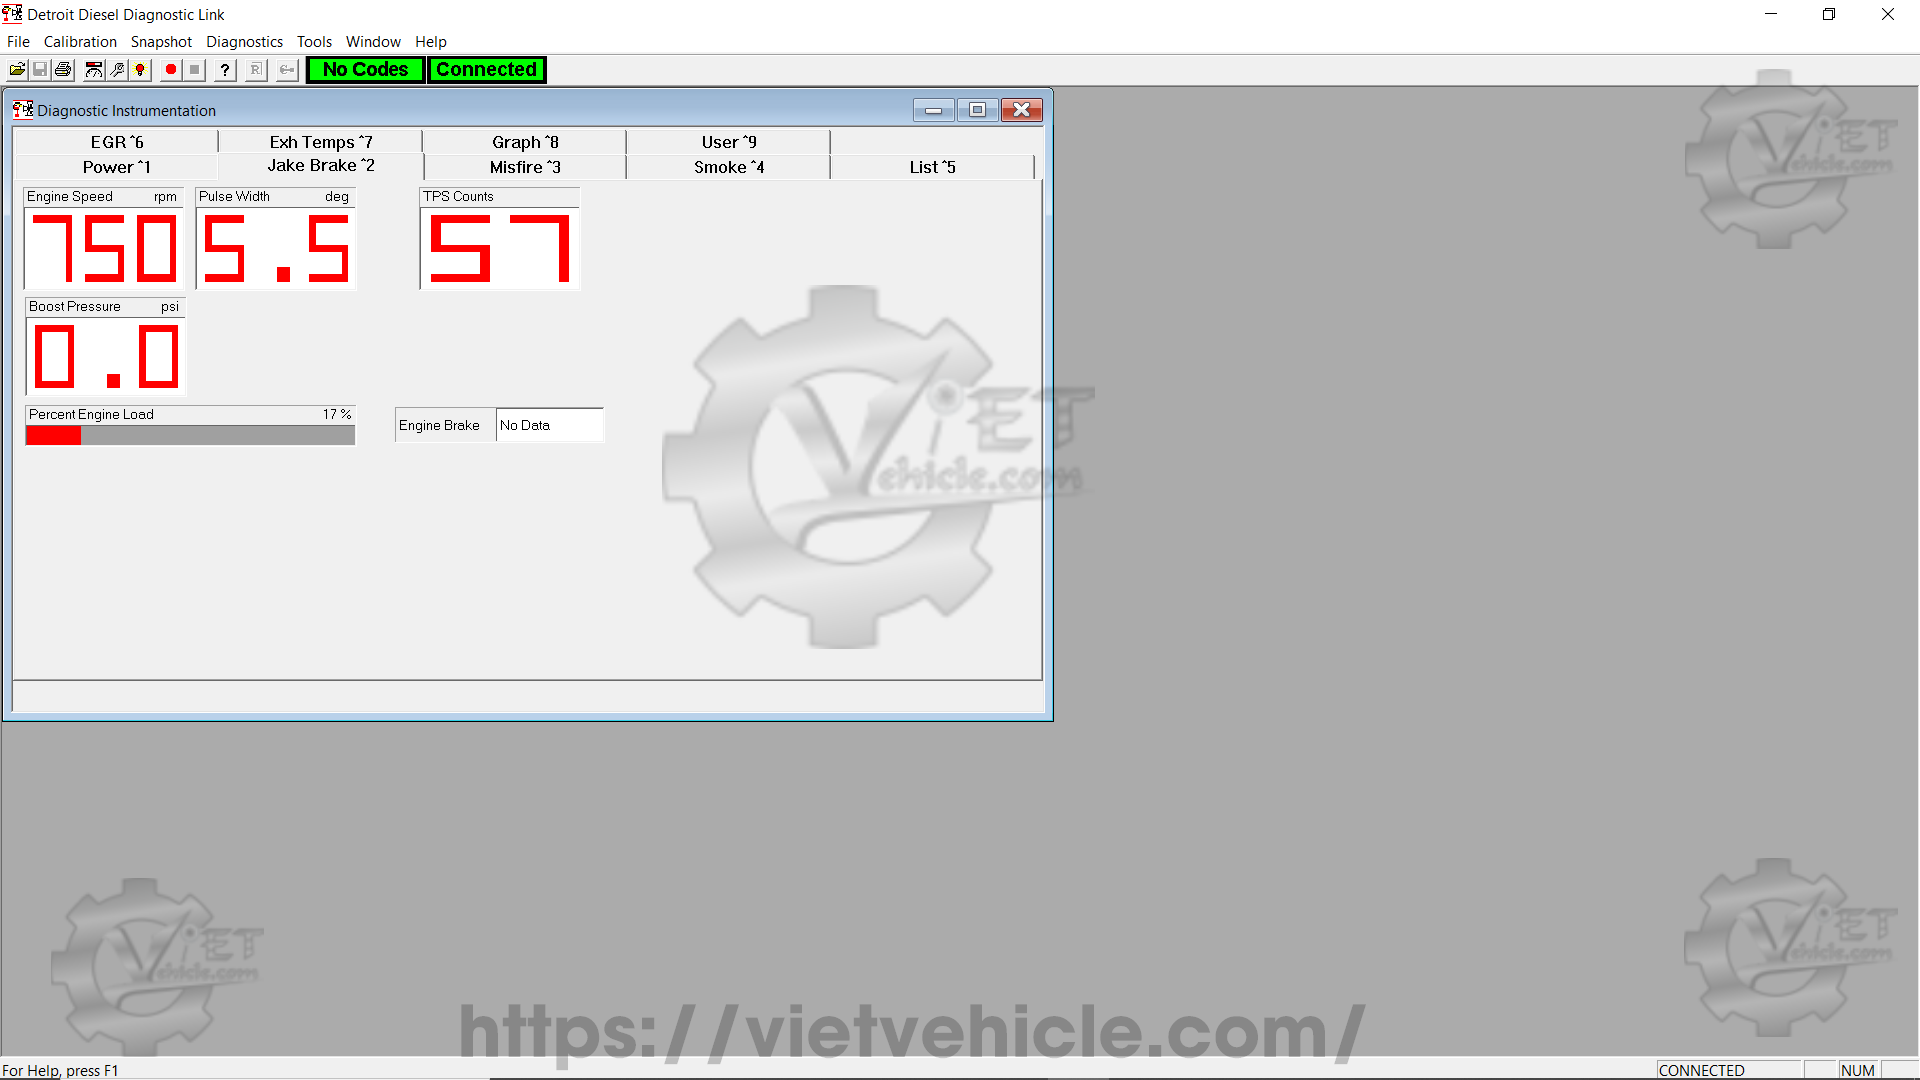
Figure 1.4 – Diagnostic Instrumentation (Jake Brake 2)
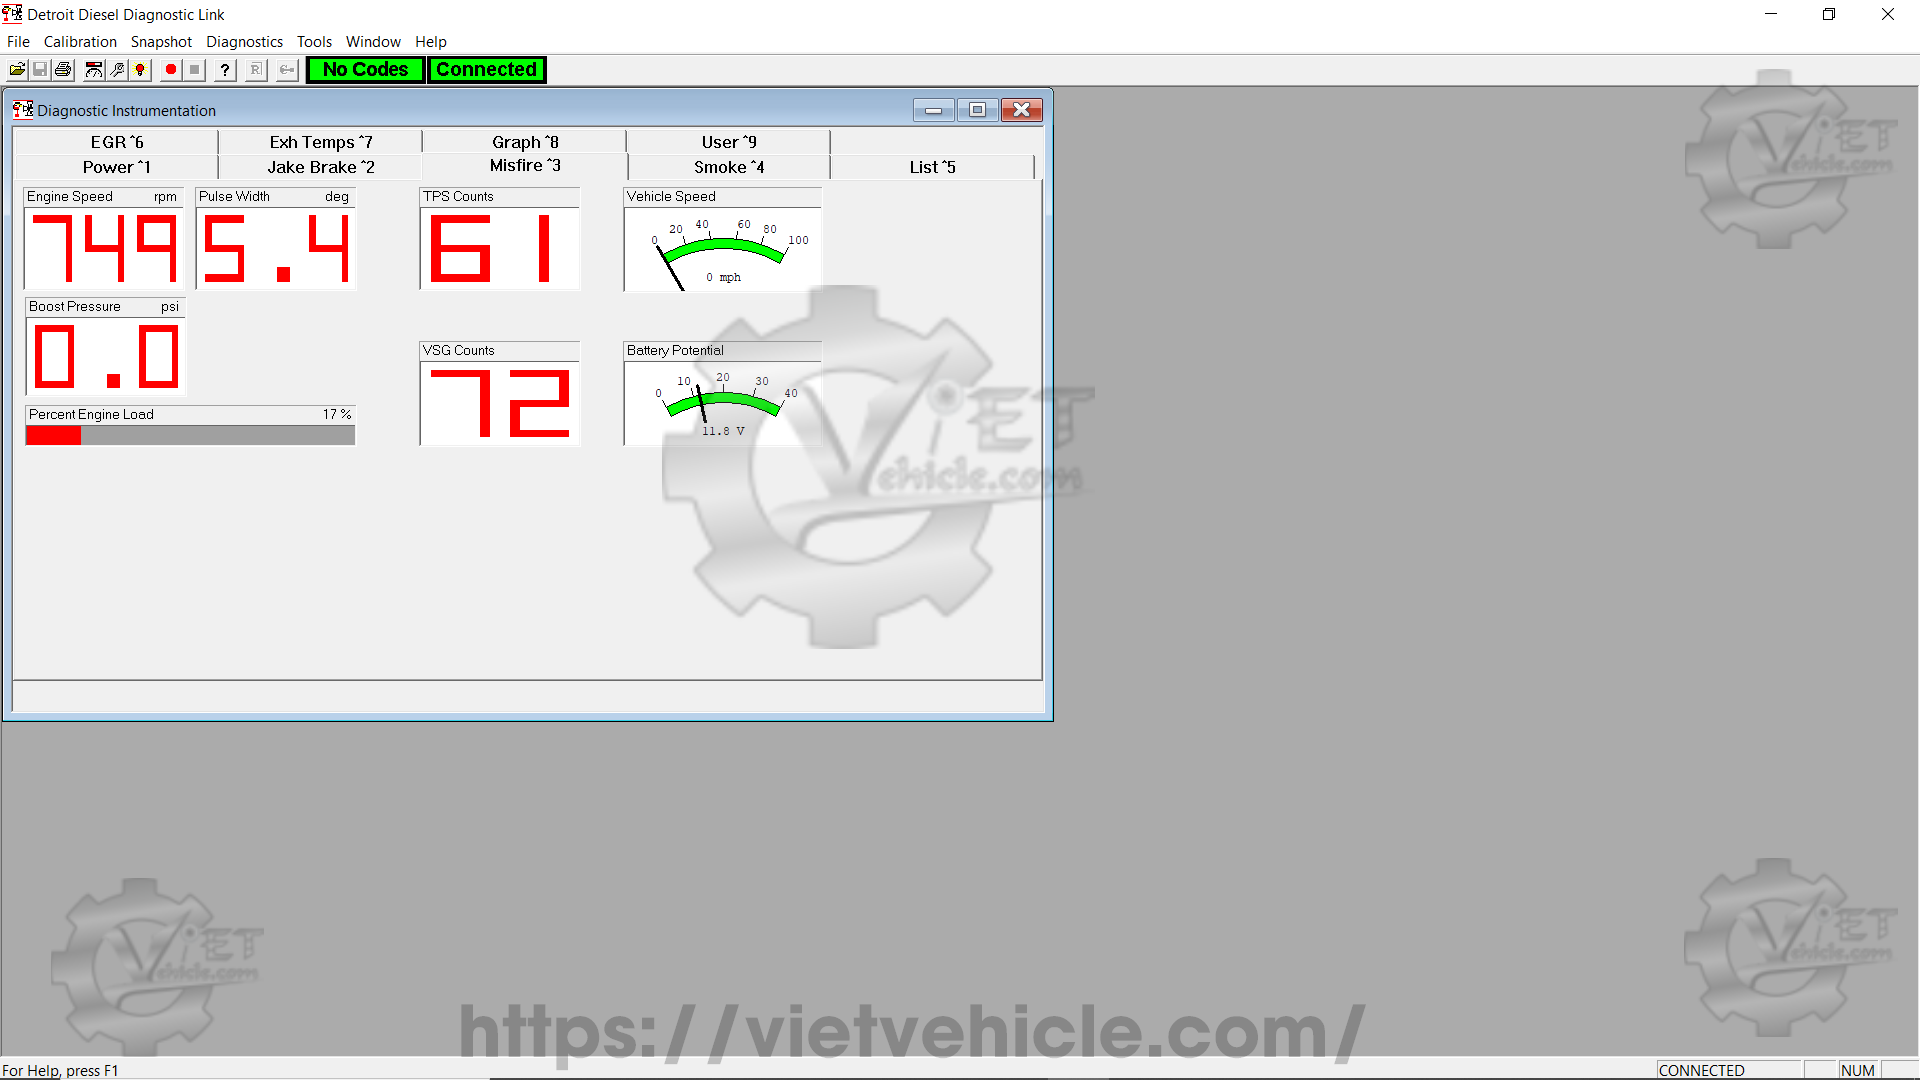
Figure 1.5 – Diagnostic instrumentation (Misfire 3)
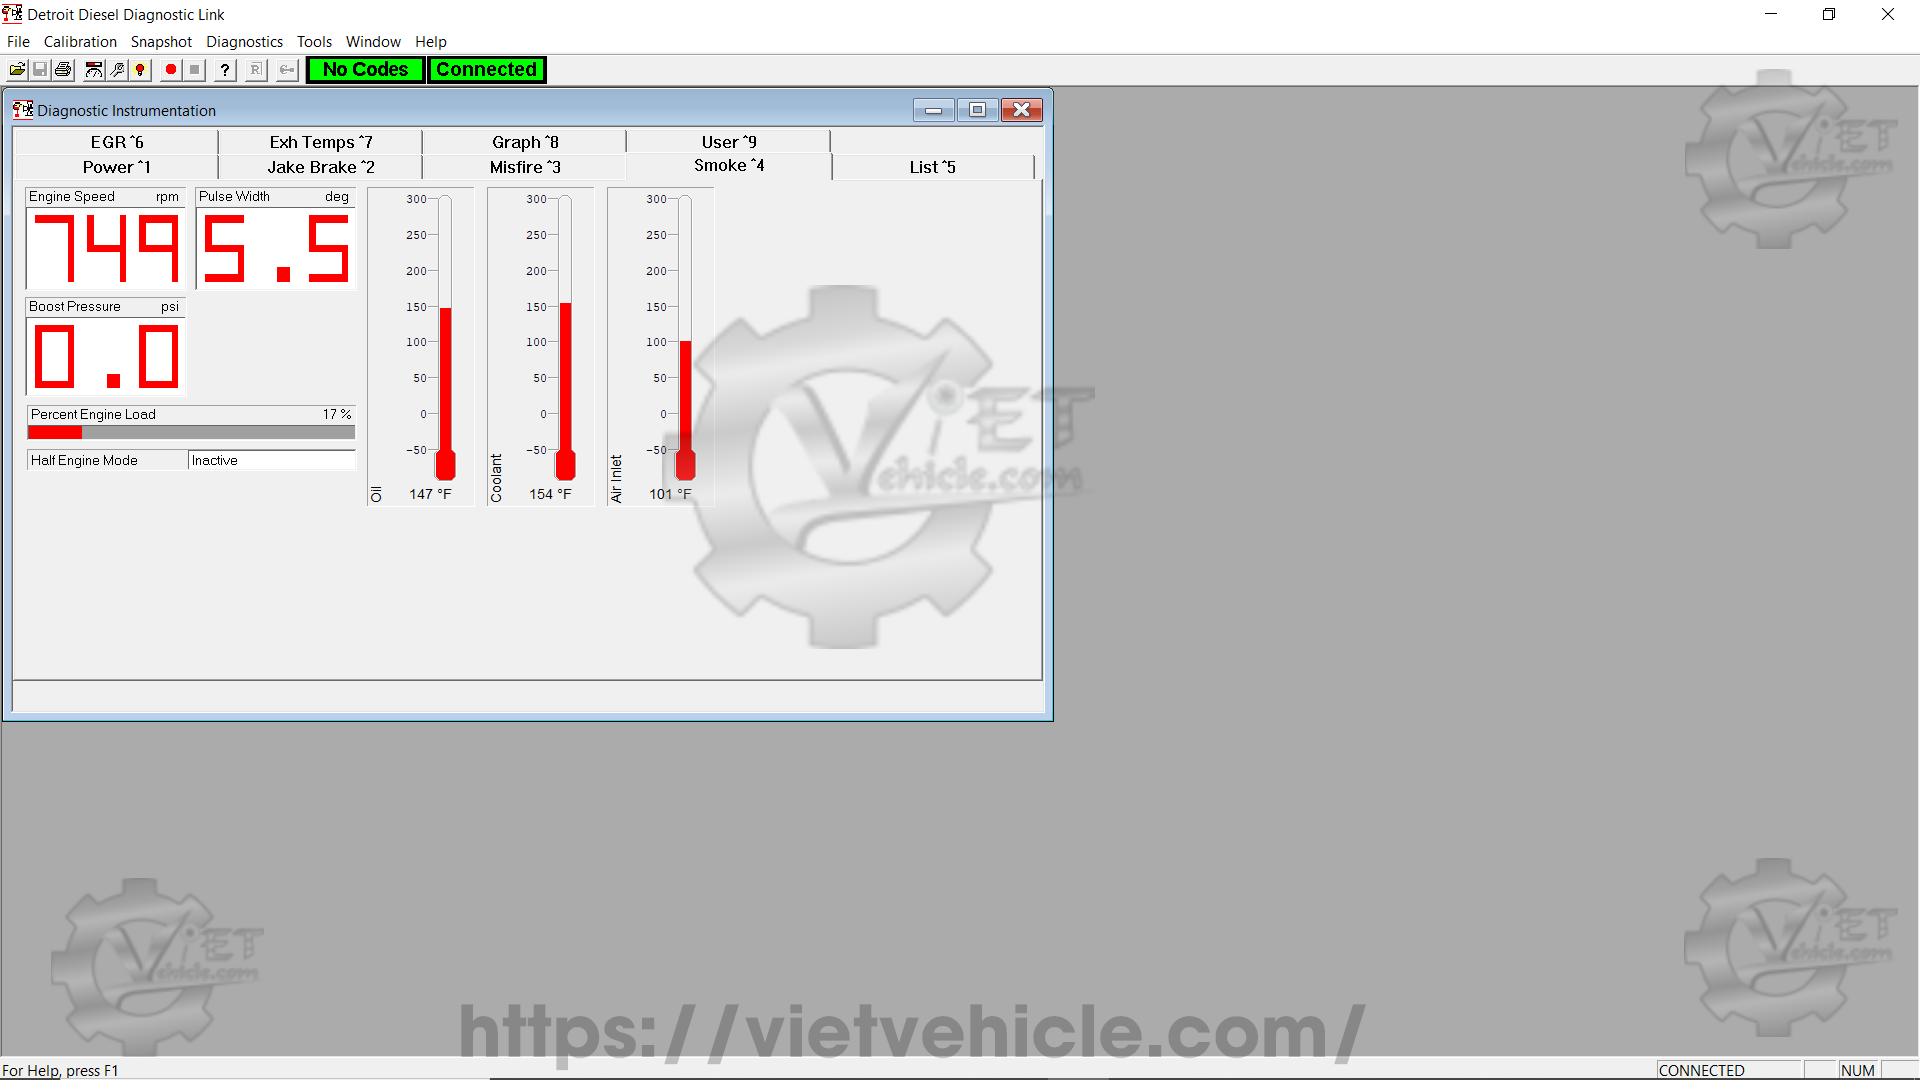
Figure 1.6 – Diagnostic Instrumentation (Smoke 4)
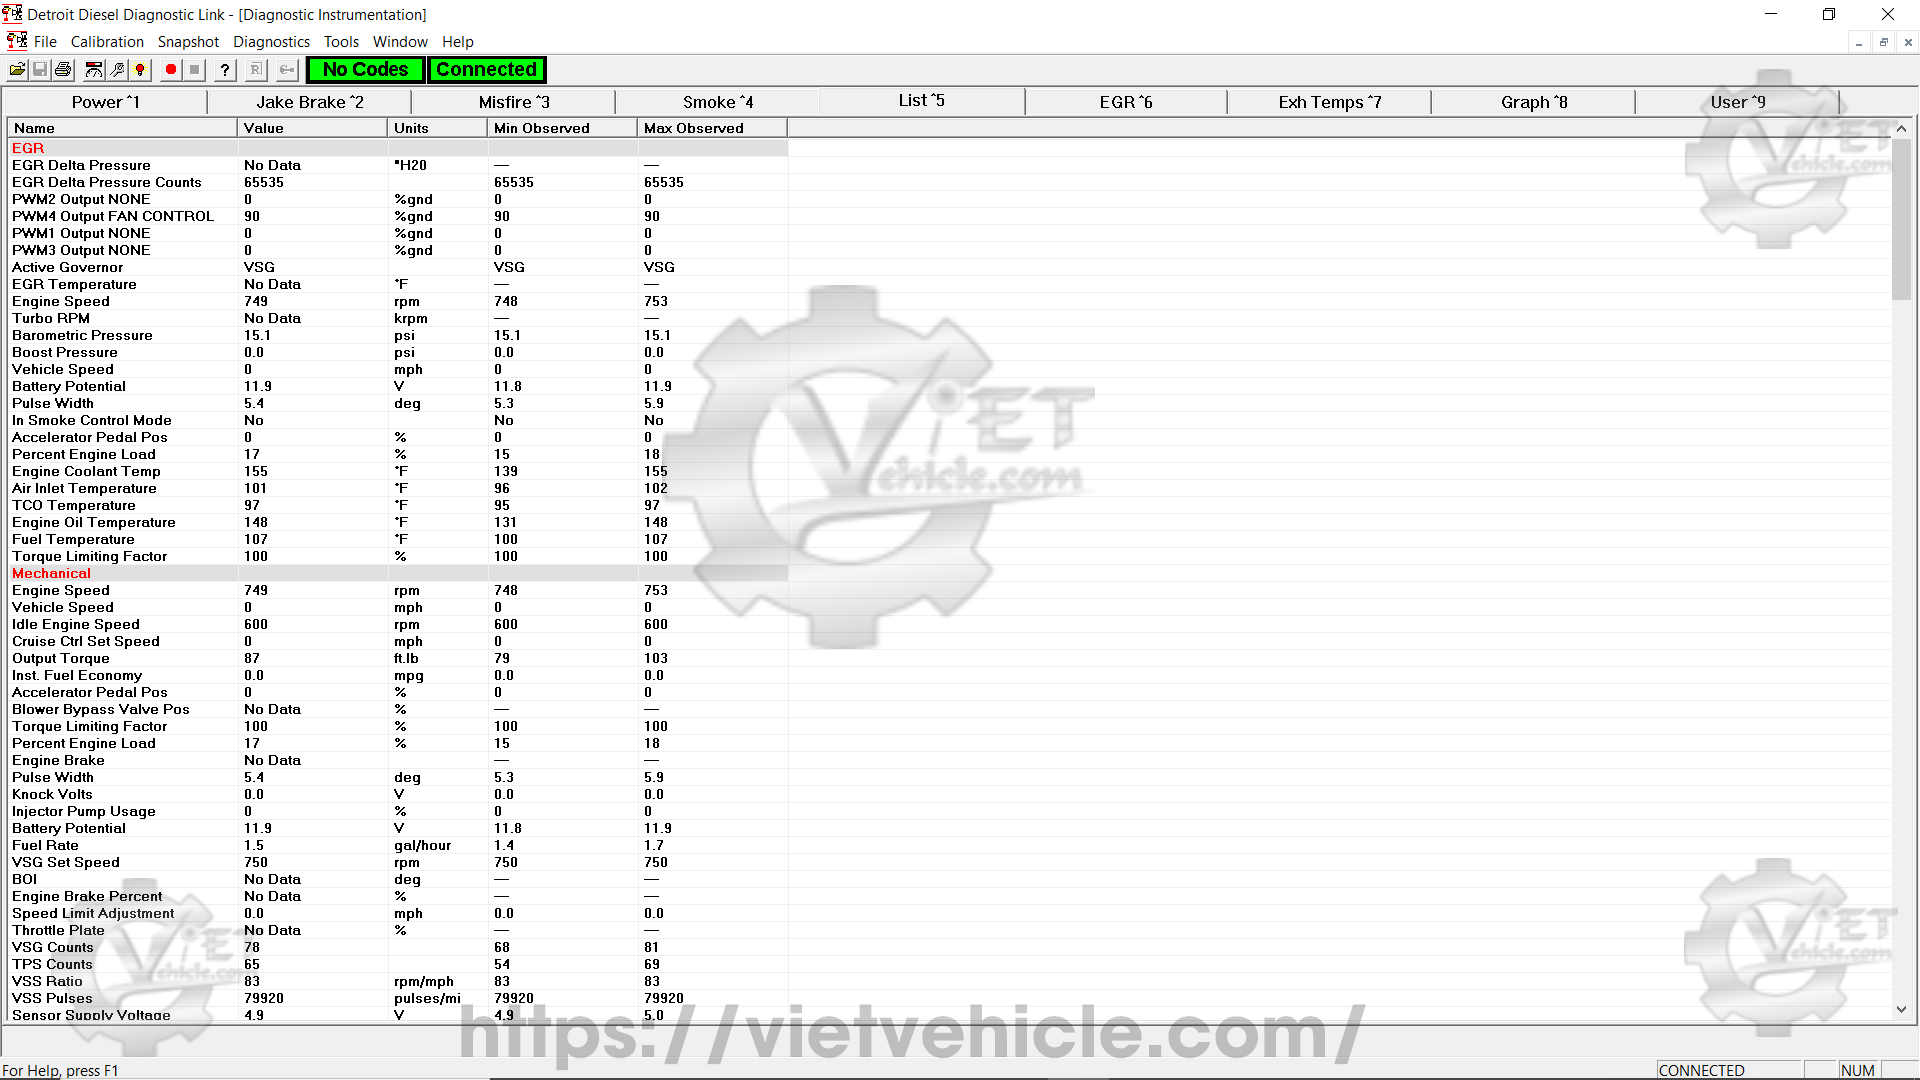
Figure 1.7 – Diagnostic Instrumentation (List 5)
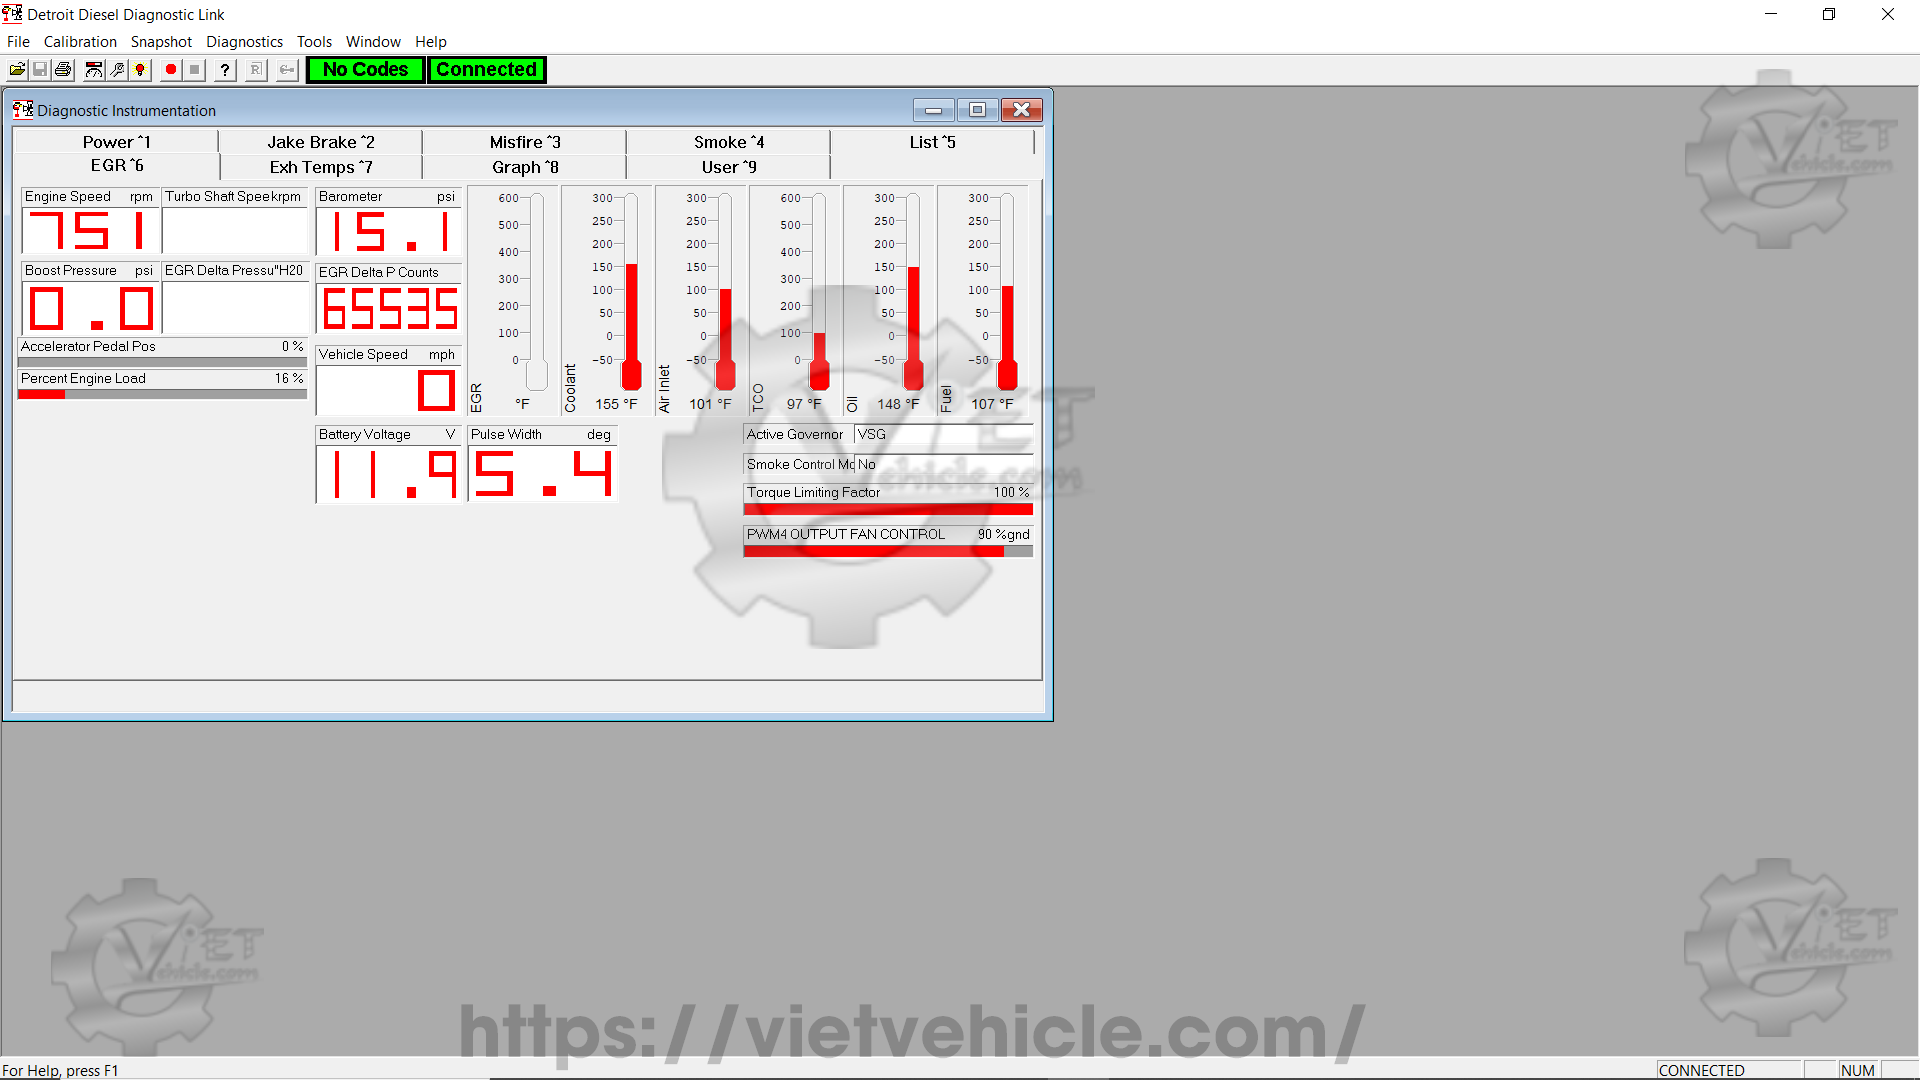
Figure 1.8 – Diagnostic Instrumentation (EGR)
4). You can customize the information displayed in the Instrumentation window using the Graph or User pages.
Clicking on the Graph tab in the Instrumentation window opens the Graph page:
- The Graph page show traces that show the variation of selected measurements
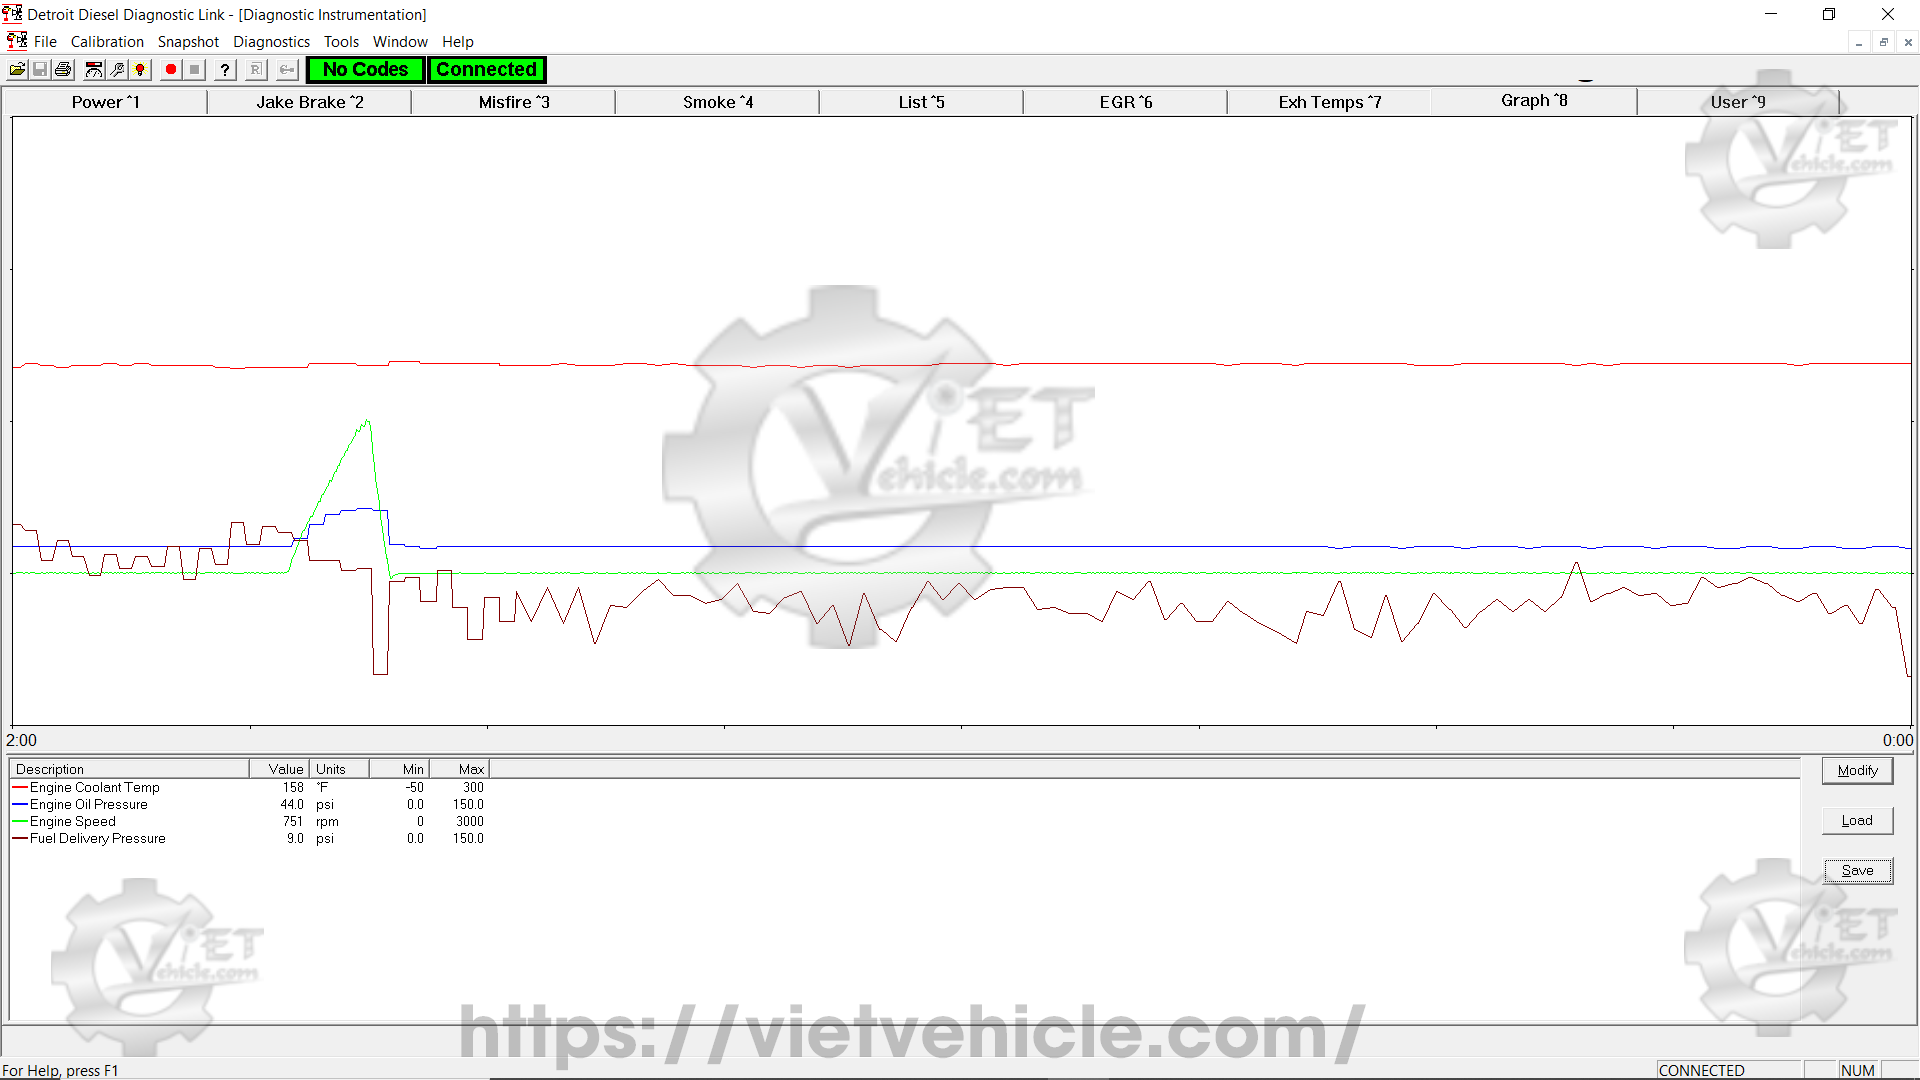
Figure 1.9 – Diagnostic Instrumentation (Graph*8)
Clicking the User tab in the Instrumentation window opens the User Page.
- The User Page lets you monitor selected measurements by assigning them to specific instruments.
→ The page includes four meters: one digital meter and three indicators.
→ To select the measurements to monitor:
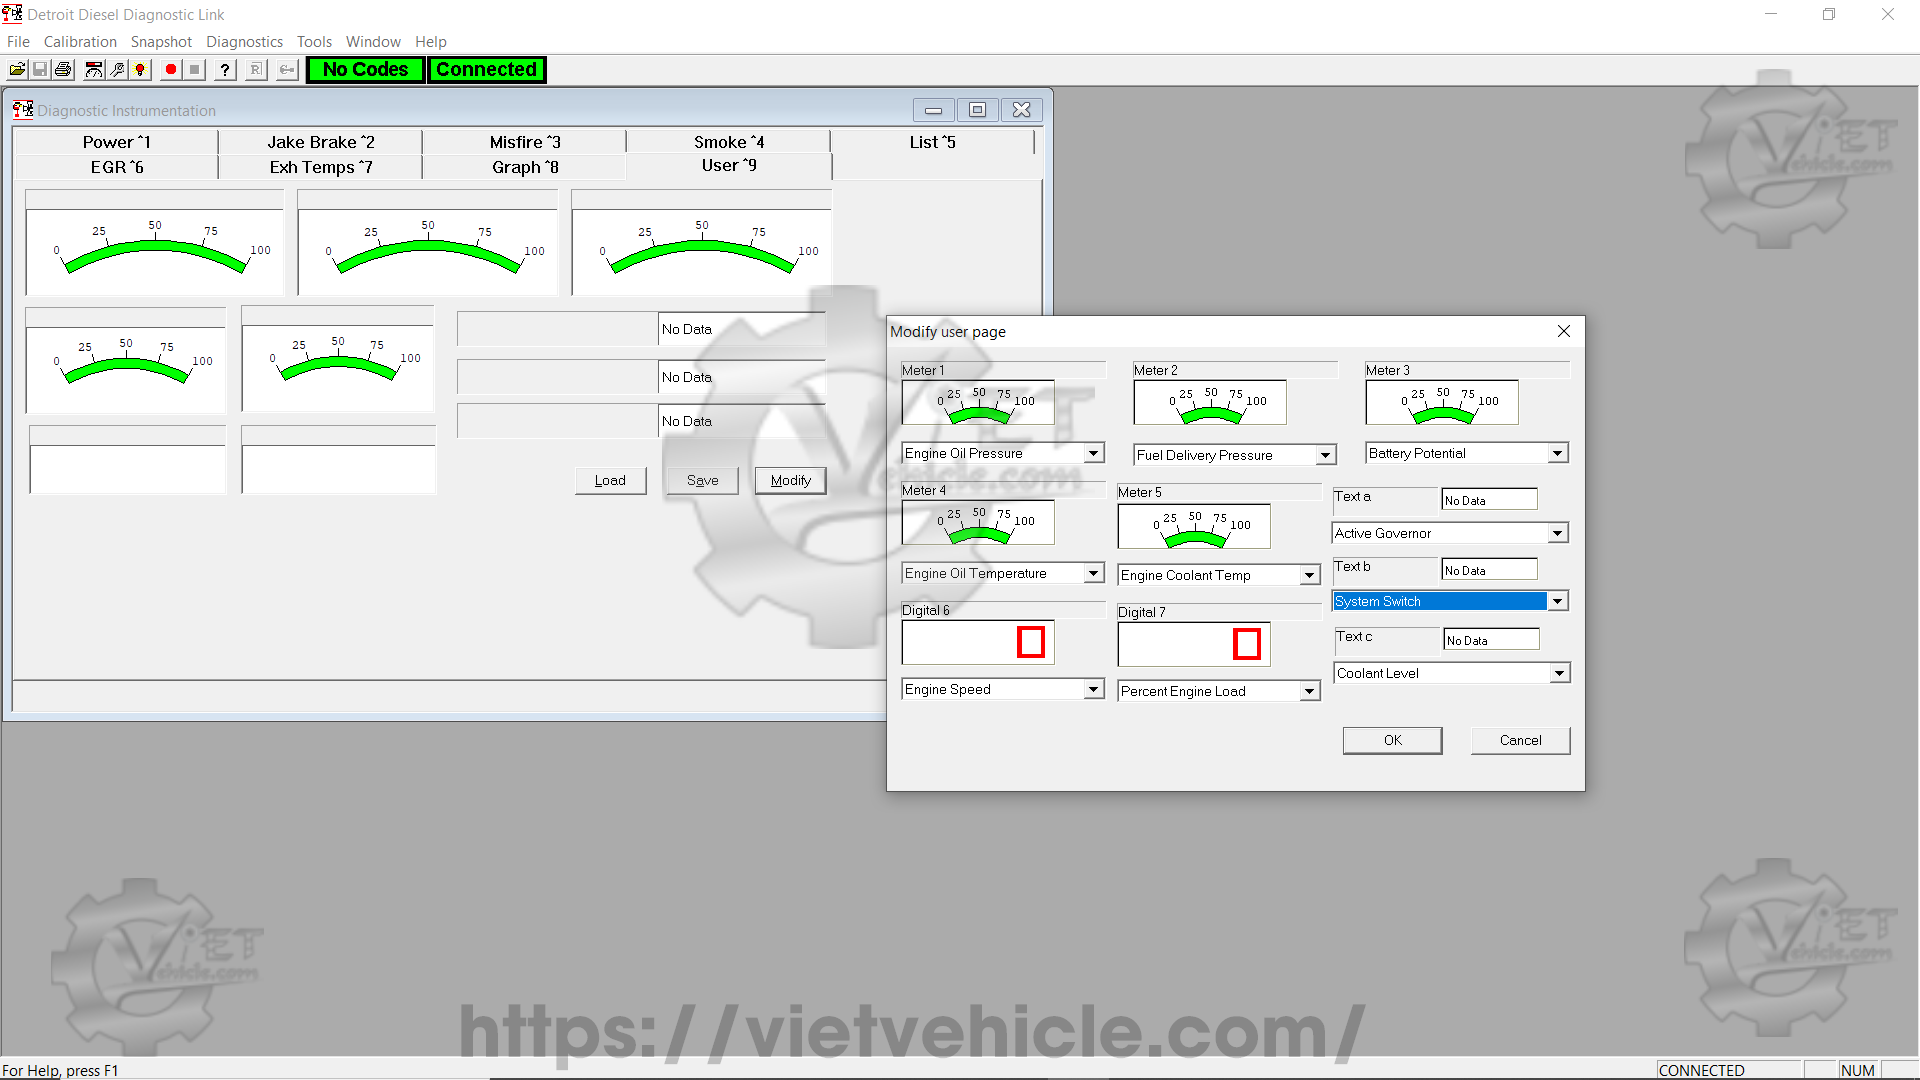
Figure 1.10 – Diagnostic Instrumentation (User 9)
Press Modify to open the Modify User Page dialog box:
- For each instrument, select the desired measurement from the drop-down list below it.
→ When you close the Modify User Page dialog box, the instruments will display the current values of the selected measurements.
To save the current user page settings to a file:
- Press Save to open the standard Save As dialog box.
- Select the folder where you want to save the file.
- Enter a File Name for the file.
- Press Save to store the file and close the dialog box.
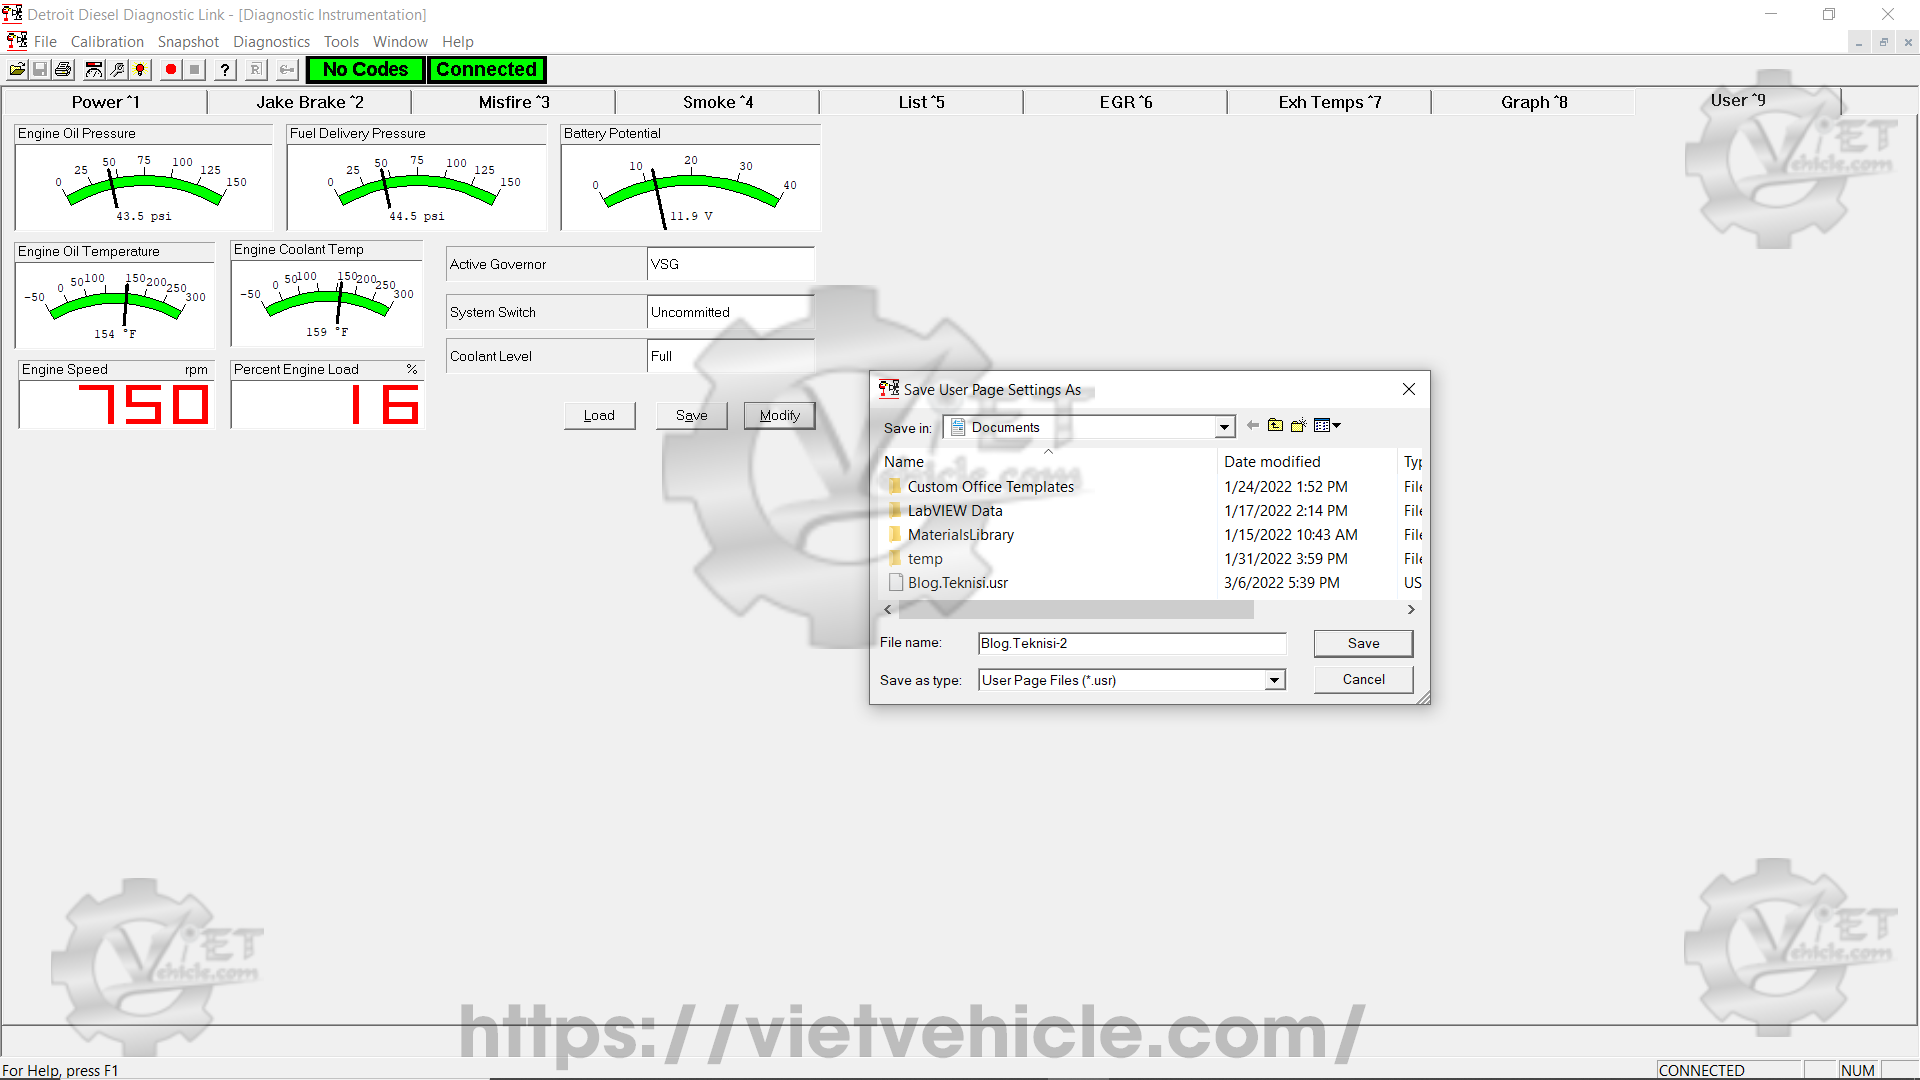
Figure 1.11 – Save User Page Settings As
To Load Previously Saved Graph Page Settings:
- Click Load to open a standard Windows Open dialog box.
→ Navigate to the folder containing the saved file. - Select the desired file by clicking on its name.
- Click Open to close the dialog box and apply the saved settings.
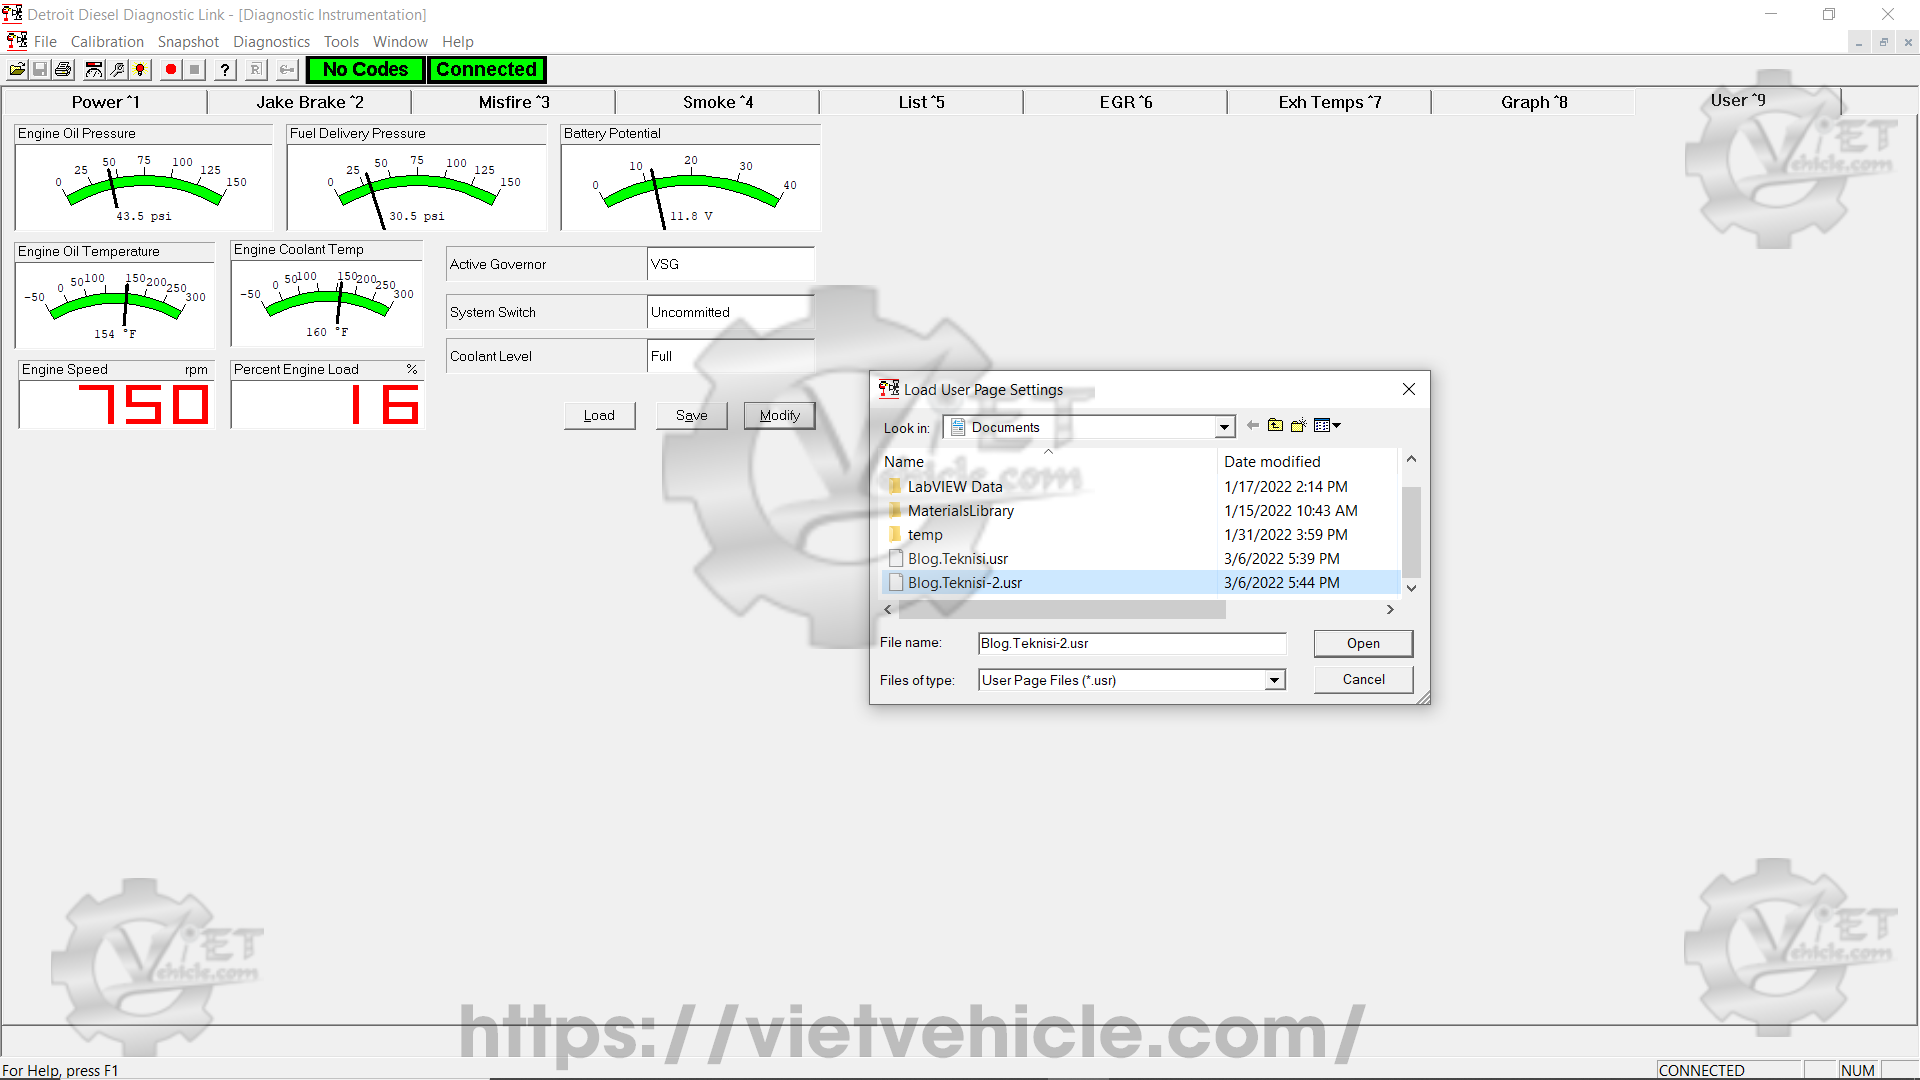
Figure 1.12 – Load User Page Settings
Contact Us
Whatsapp: +84.858.966.333
Facebook: VIETVehicle Remote Delete Service
YouTube: VIETVehicle – ECM Delete Tuning
Tiktok: VIETVehicle.com
Website: VIETVehicle.com


