Data Monitor/Logger
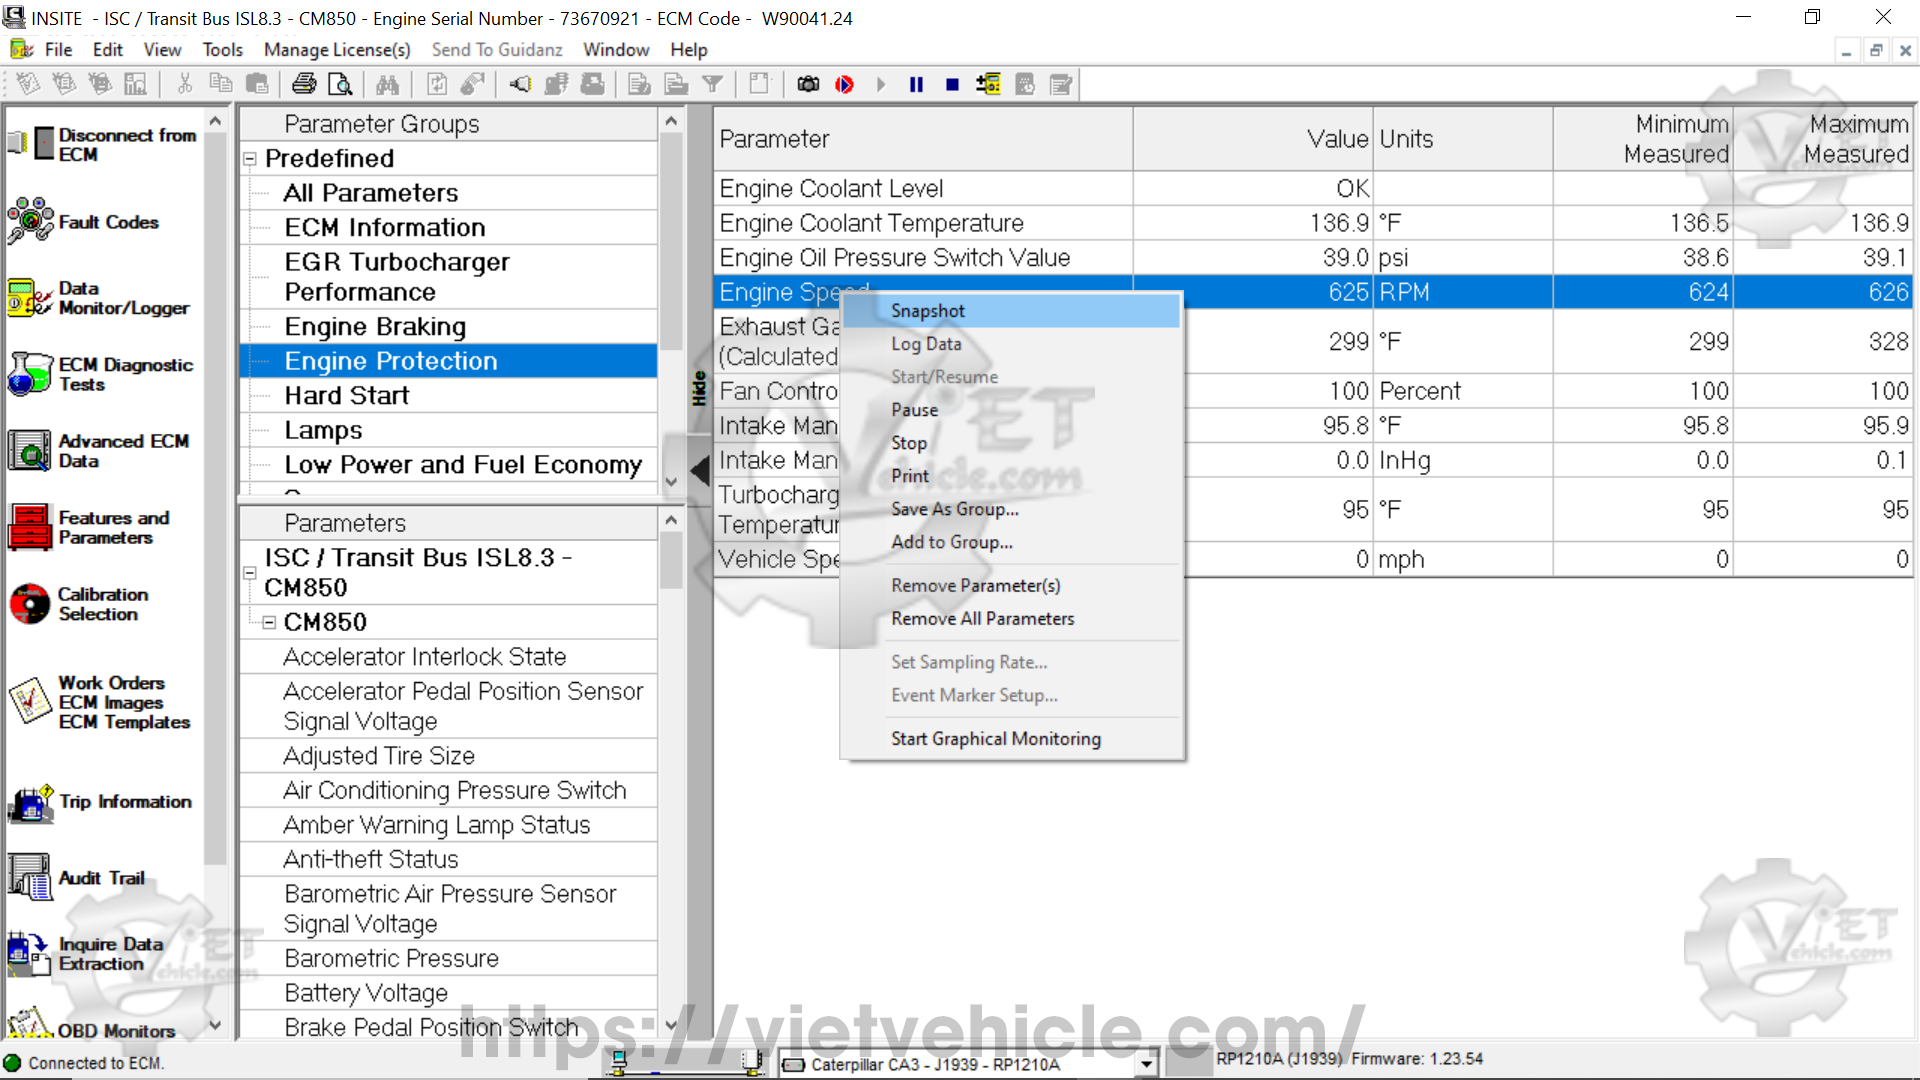
Figure 1.1 – Engine Protection (Snapshot)
The Data Monitor/Logger allows you to view live engine data or log it to a file for later analysis. Technicians can choose specific parameters to monitor or select from predefined and custom parameter groups. The sampling rate for parameter updates can also be adjusted.
Once parameters are selected, they can either be monitored in real-time without recording or both monitored and logged as a continuous data stream. Additionally, snapshots can be taken at any time to capture parameter values at a specific moment.
The Data Monitor/Logger can also be used to track ECM data during testing.
- Select Data Monitor/Logger from the viewbar (left-side menu).
- Or go to View > Current > Data Monitor/Logger from the menu bar.
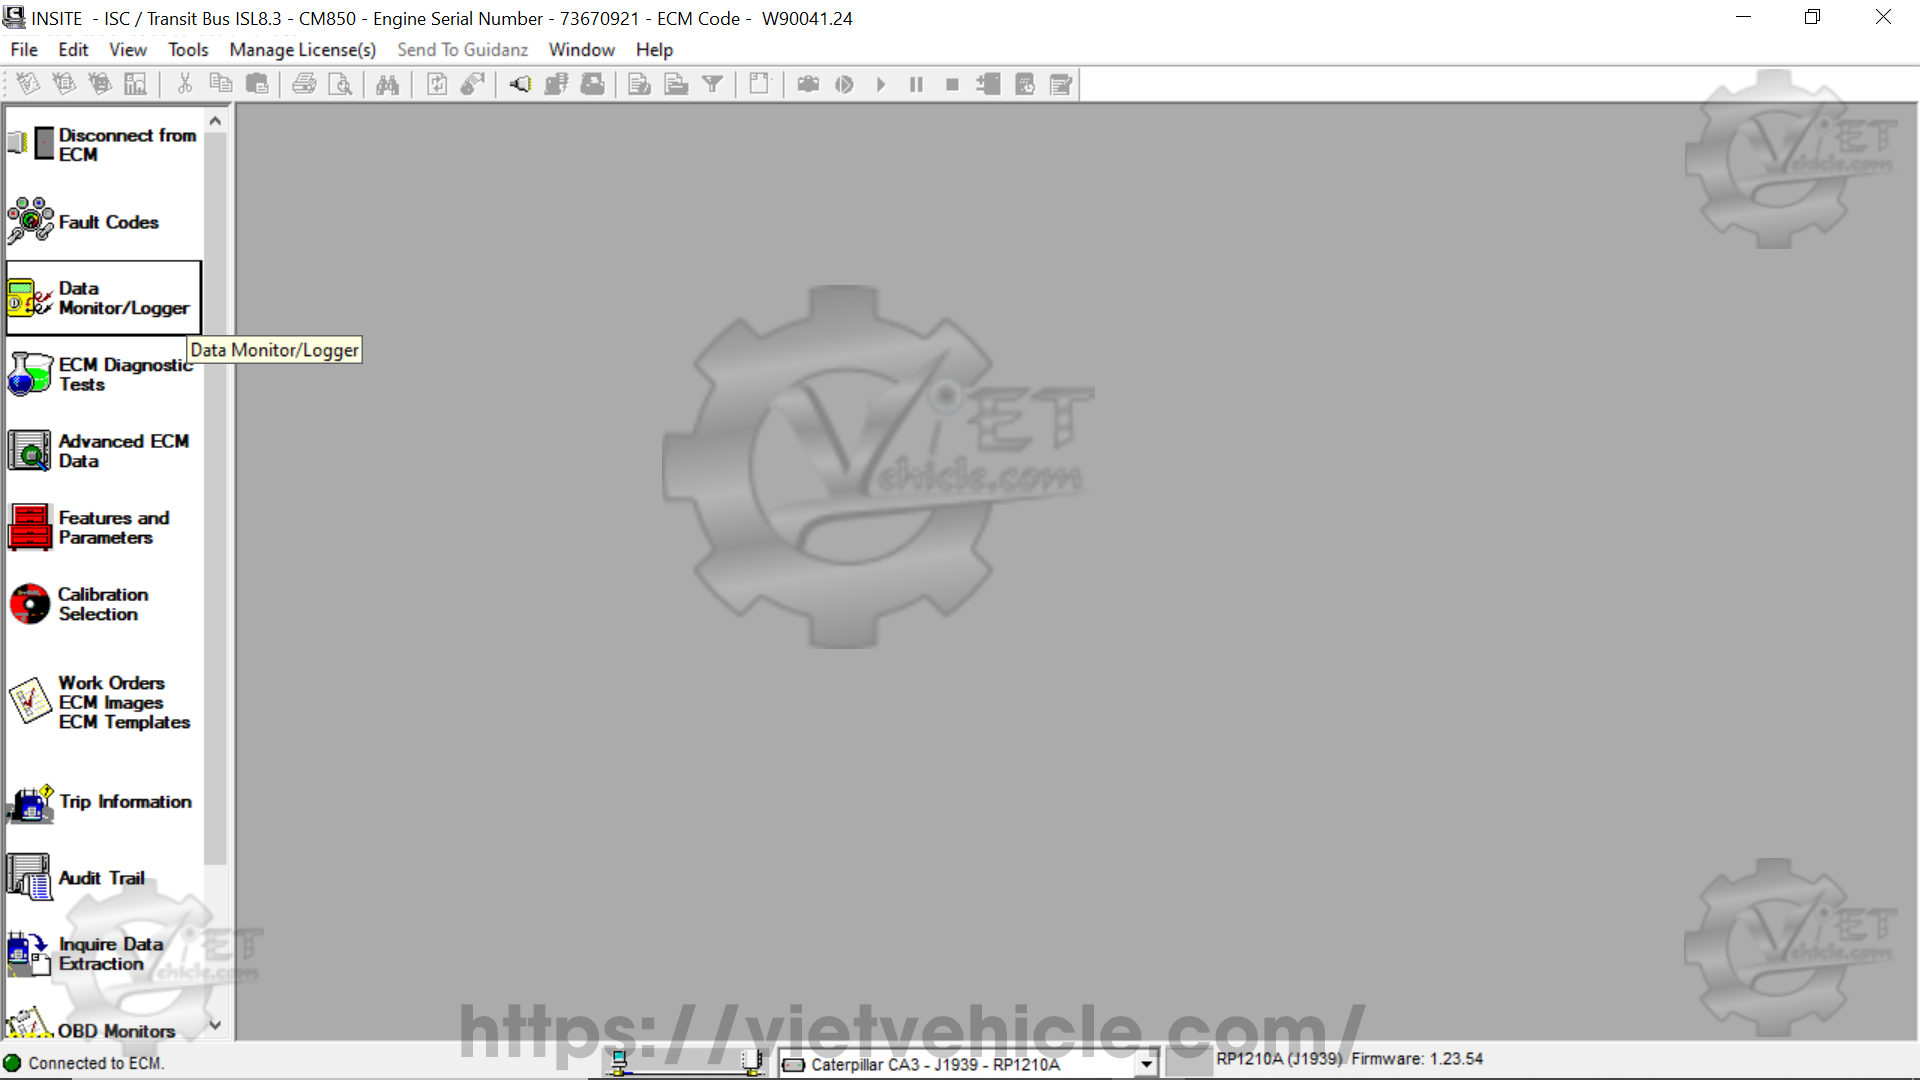
Figure 1.2 – Data Monitor/Logger
#Data Monitor/Logger Window
The Data Monitor/Logger window has three areas: Parameter Groups, Parameters and Selected Parameters List.
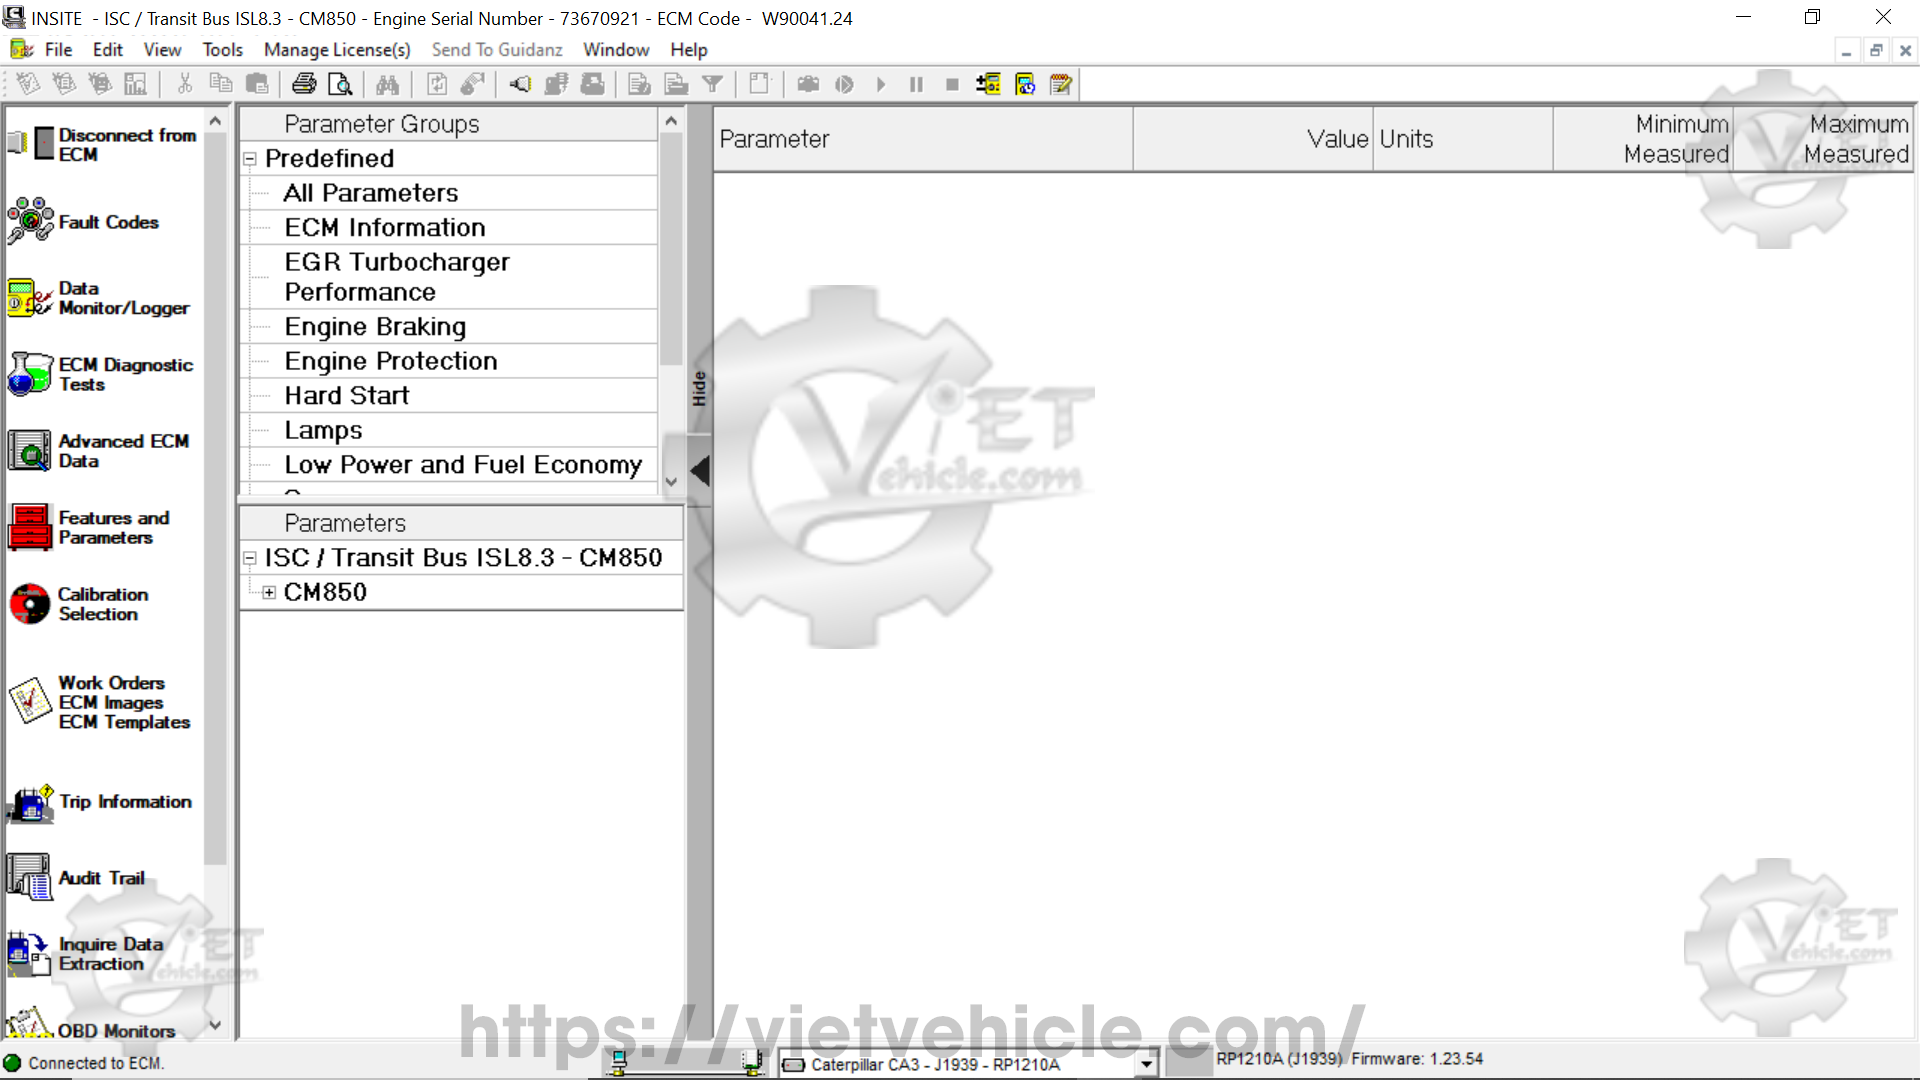
Figure 1.3 – Data Monitor/Logger Window
- A) Parameter Groups
Parameter Groups are shown in the upper-left section of the Data Monitor/Logger window. INSITE includes predefined monitor groups such as Engine Braking, Switches, and Sensors. Additionally, users can create custom groups as needed.
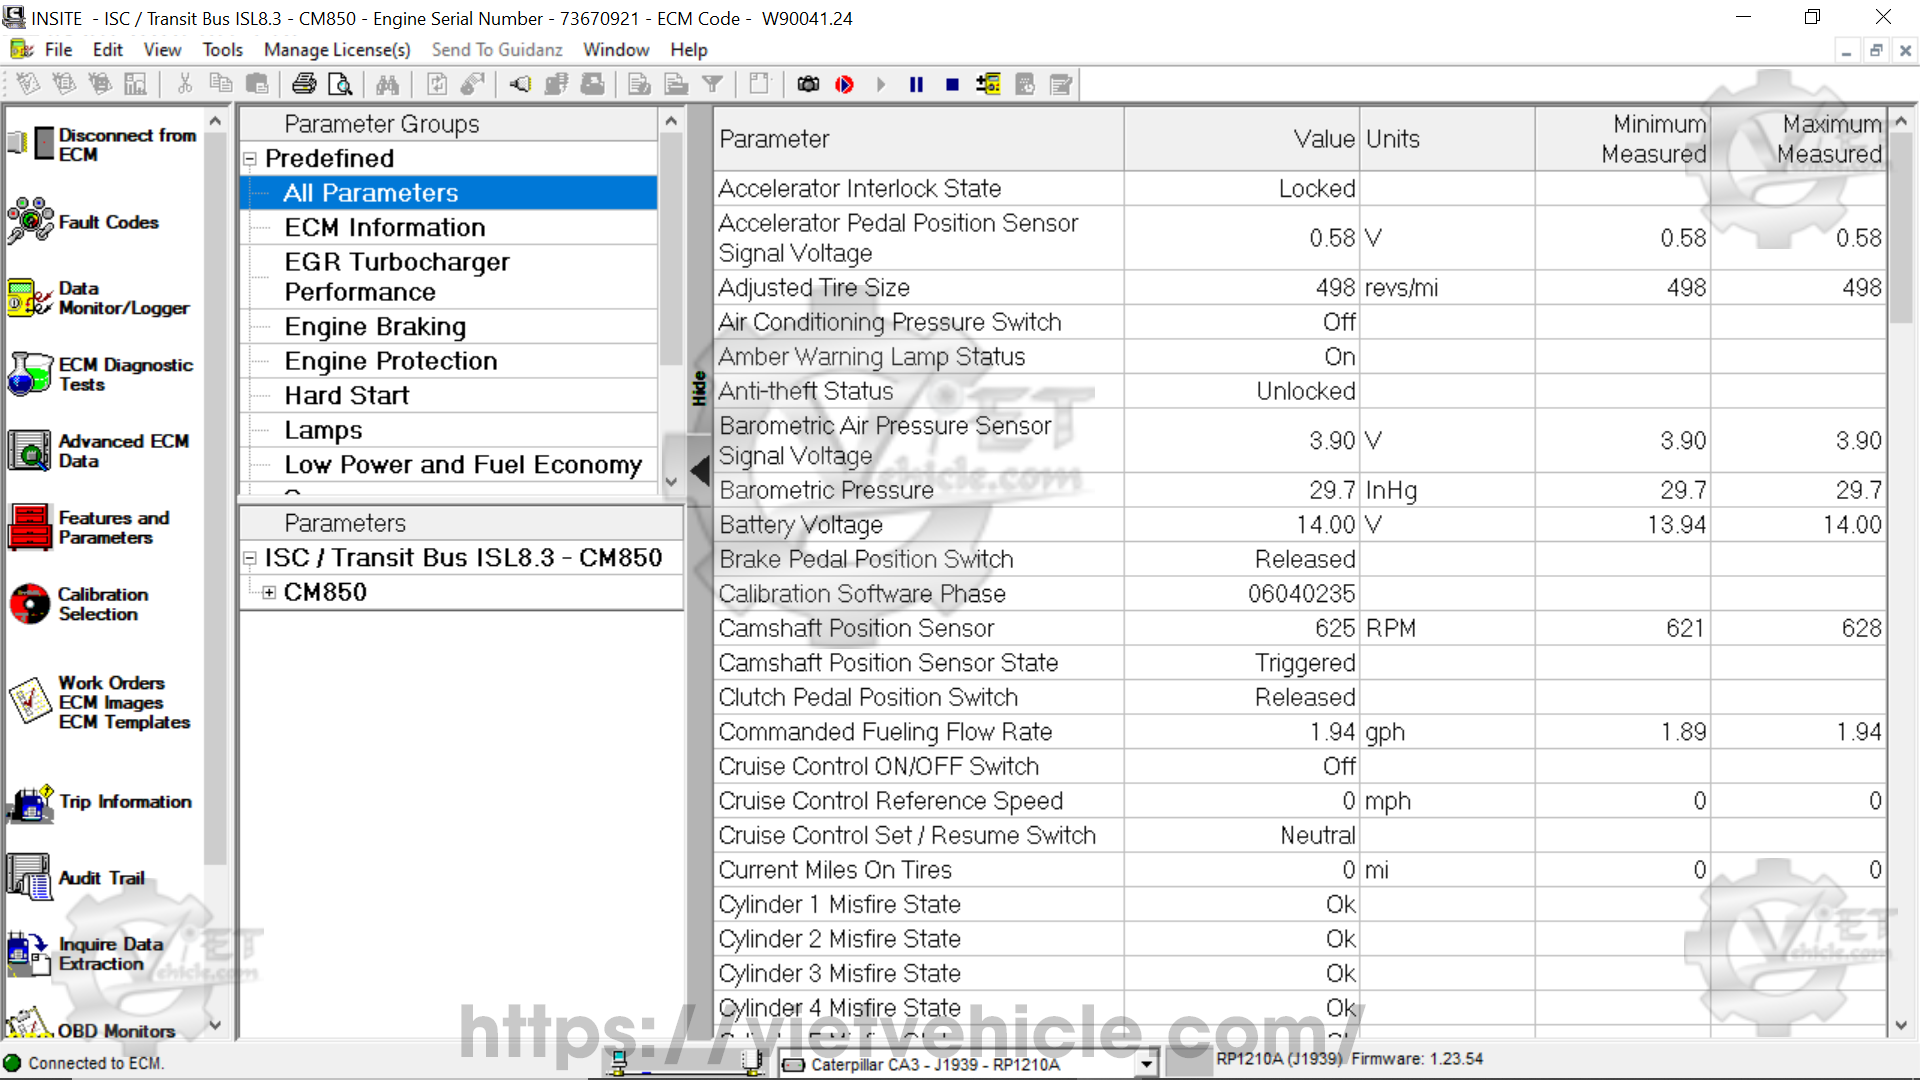
Figure 1.4 – All Parameters (Predefined)
B). Parameters
Parameters are listed in the lower-left section of the Data Monitor/Logger window and are organized by ECM. Individual parameters can be selected for monitoring. Parameters added to the Selected Parameters list are marked with a monitor icon. When a Predefined or Custom Monitor Group is selected, its associated parameters appear in bold font.
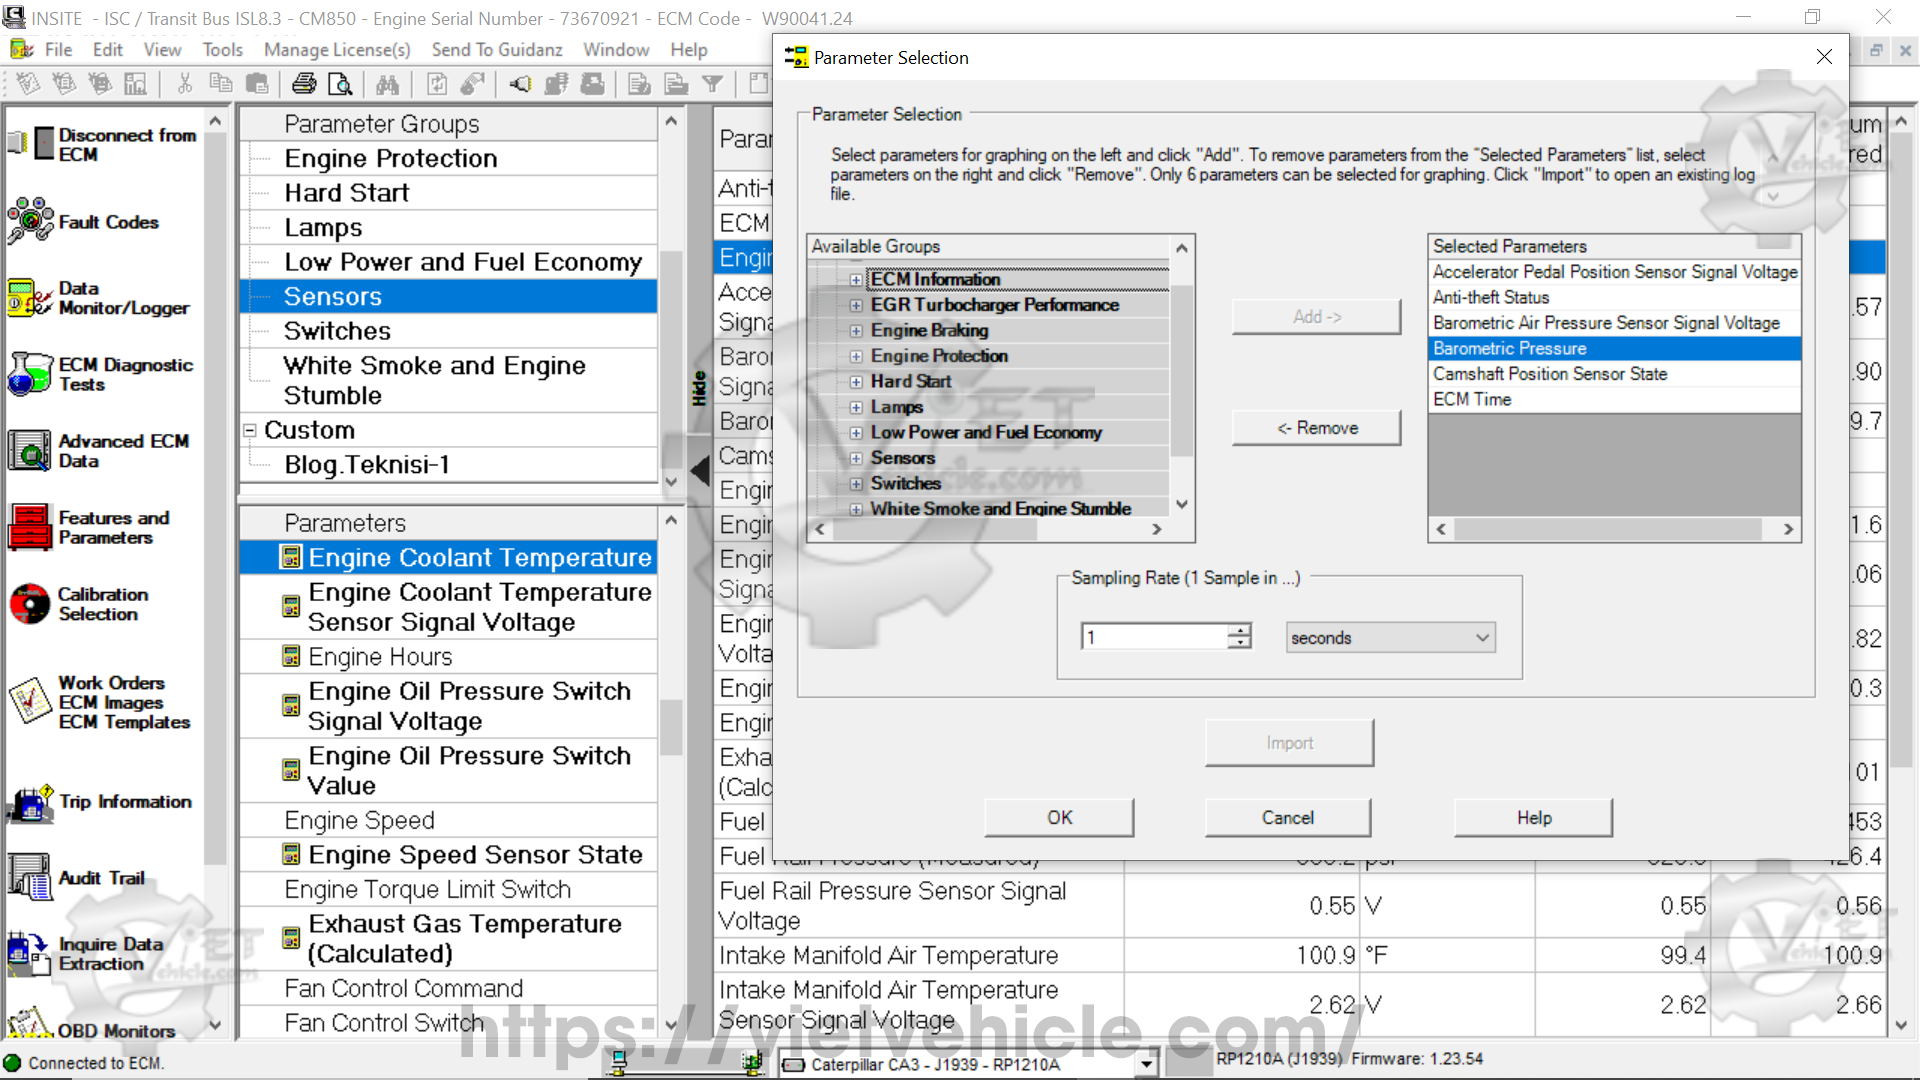
Figure 1.5 – Parameter Selection
C). Selected Parameters List
The right-hand section of the Data Monitor/Logger window displays the Selected Parameters along with their current values (once monitoring or logging begins), units of measure, and the Upper (Maximum Measured) and Lower (Minimum Measured) Limits, if available.
Once parameters are selected, the Parameter Groups and Parameters sections can be hidden by clicking the Hide button on the left of the Selected Parameters List. To make them visible again, click the Show button.
#Right-Click Menu
The right-click menu provides access to various functions within the Data Monitor/Logger window. The available options in the menu depend on the mouse cursor’s location within the interface.
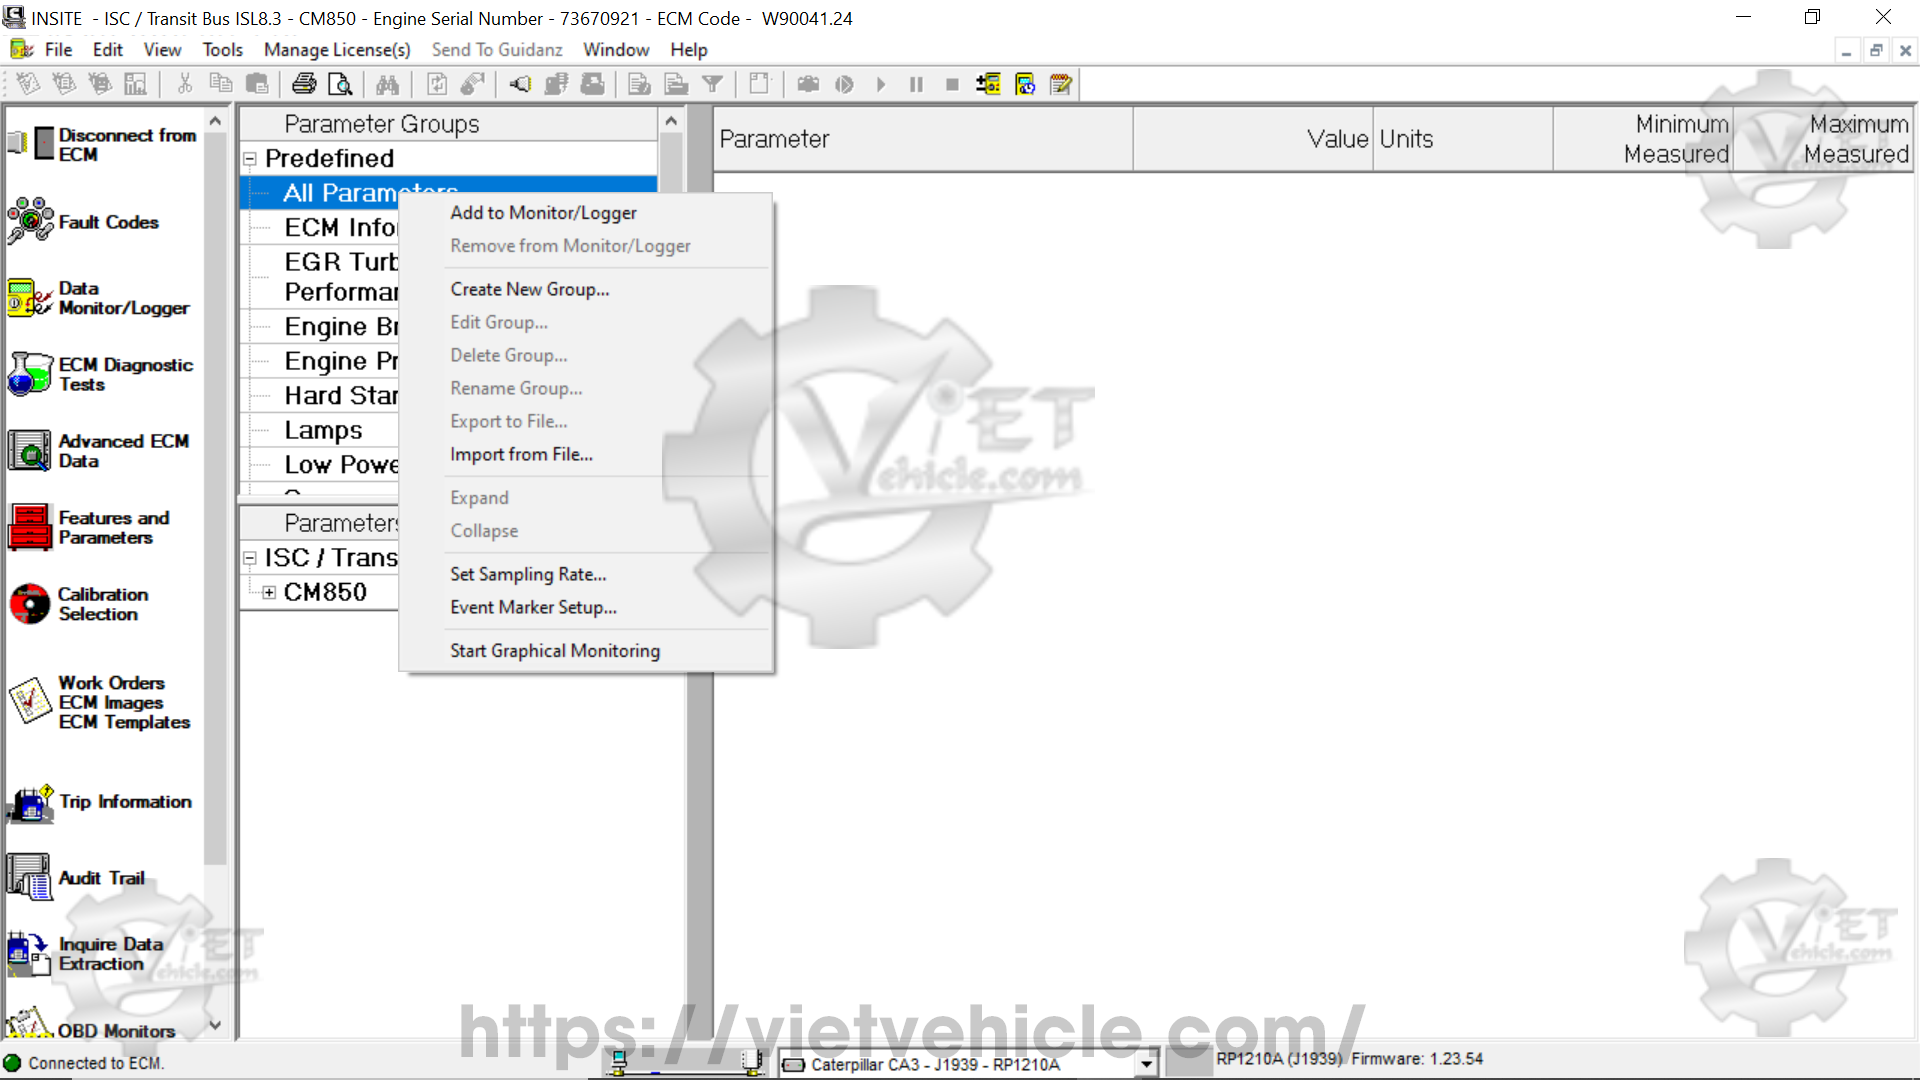
Figure 1.6 – Right Click (All Parameters)
Parameter Groups
When right-clicking within the Parameter Groups area, the following options are available. Some options may appear grayed out depending on the context.
Add to Monitor/Logger
Adds all parameters from the selected group to the Selected Parameters list.
Remove from Monitor/Logger
Removes any parameters from the Selected Parameters list that belong to the selected group.
Create New Group
Allows the creation of a Custom Monitor Group based on user-defined parameters.
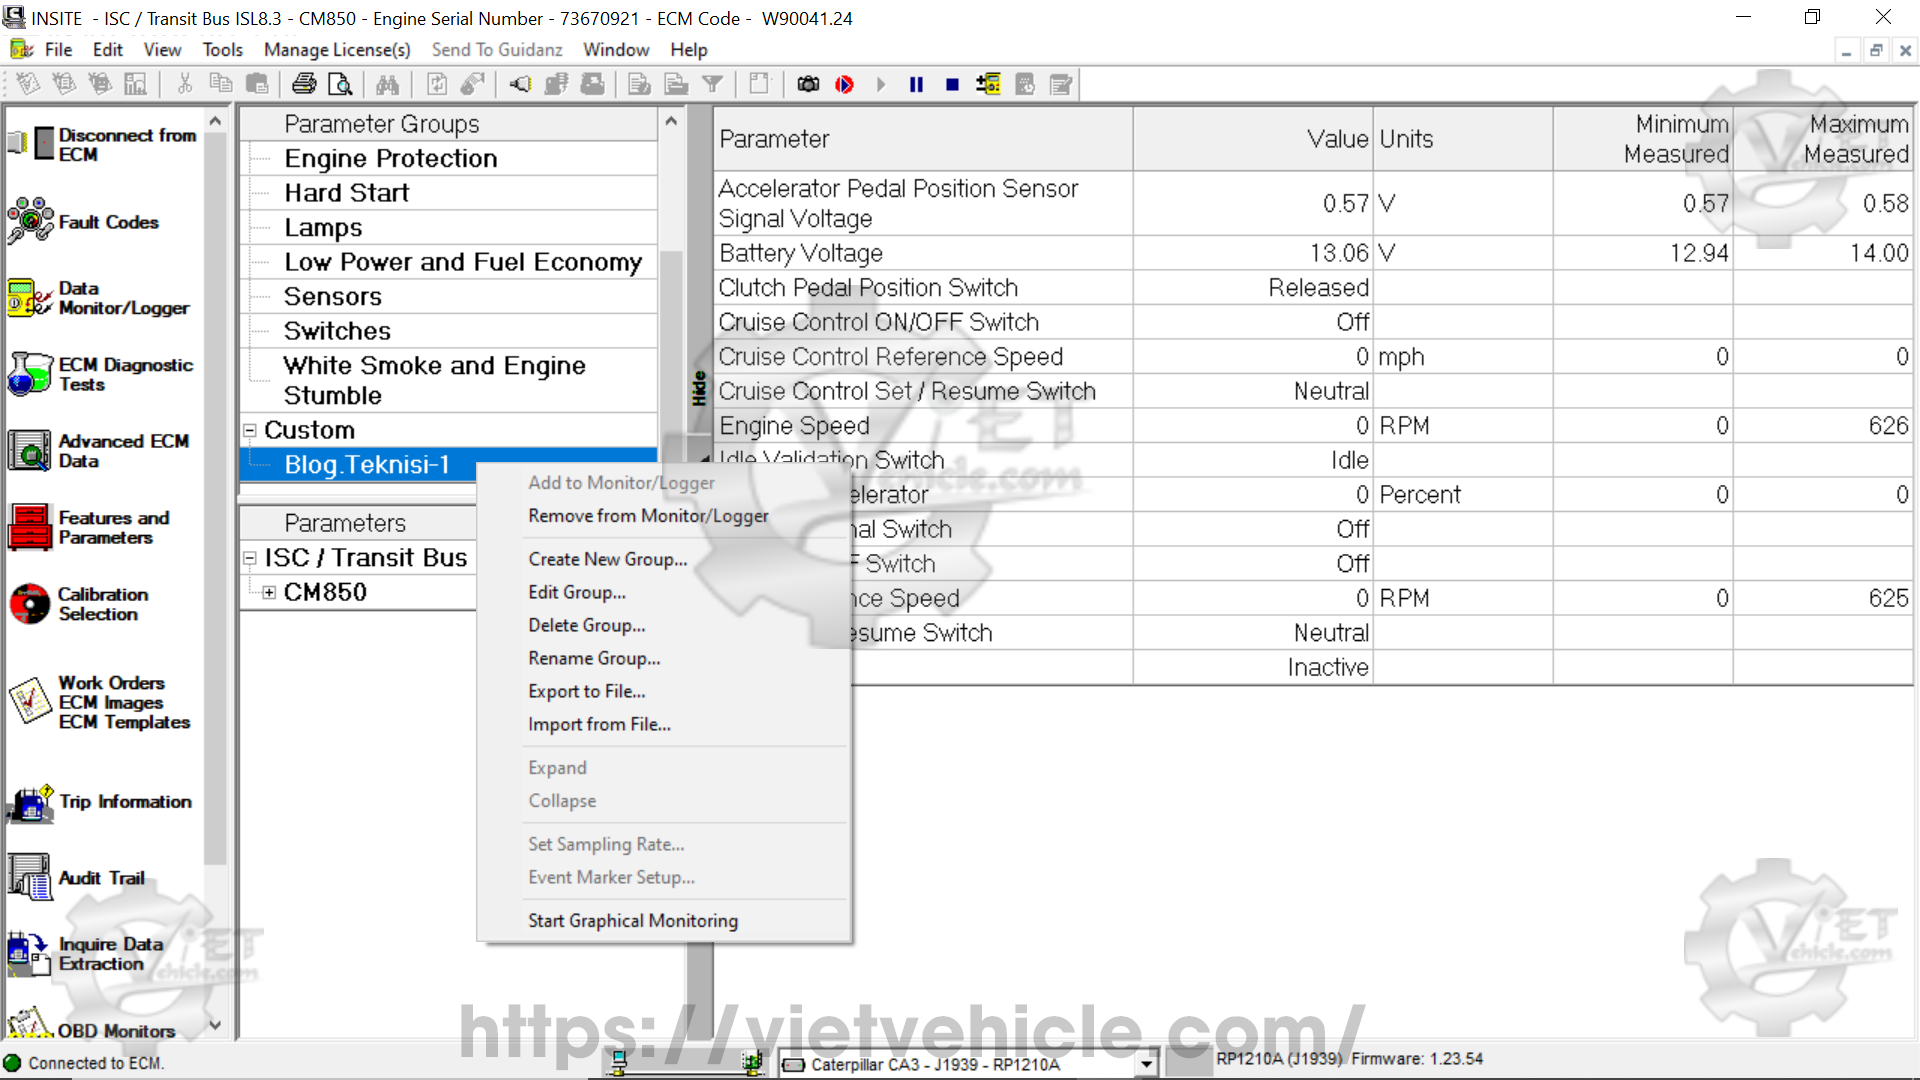
Figure 1.7 – Create Parameter Group
→Edit Group
Select this option to edit the highlighted Custom Monitor Group.

Figure 1.8 – Custom Monitor Group
-Delete Group
Select this option to delete the highlighted Custom Monitor Group.
-Rename Group
Select this option to rename the highlighted Custom Monitor Group.
-Export to File
Select this option to export the highlighted Custom Monitor Group or groups to a file.
-Import from File
Select this option to import Custom Monitor Groups from previously exported files.
-Start Graphical Monitoring
Select this option to set up graphical monitoring of the ECM data. Read More: Graphical Monitoring on Cummins INSITE Software (CUMMINS Engines).
#Logs and Snapshots
There are two ways to save monitoring data for later review. It can be saved as a Snapshot or as a Log. Snapshots contain a single occurrence of all selected parameters. A Log contains data from each of the selected parameters while the log was running.
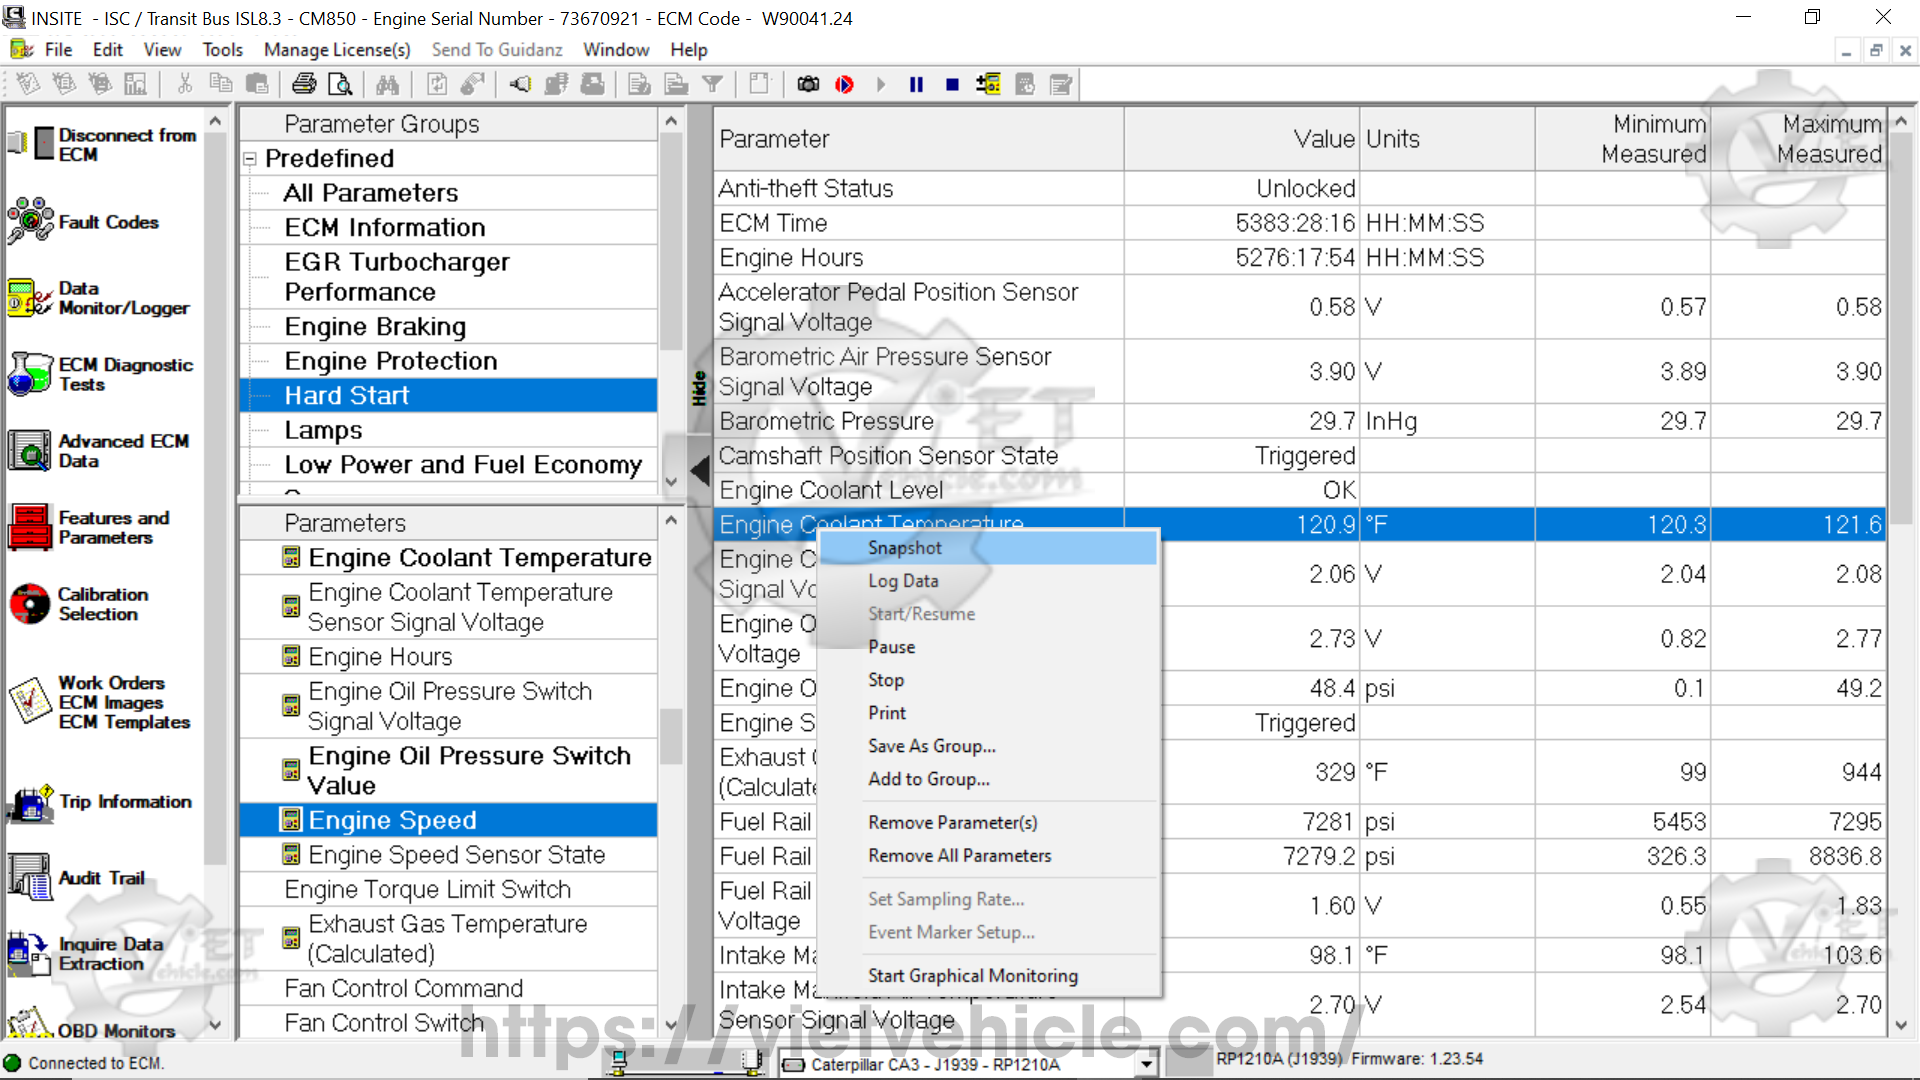
Figure 1.9 – Snapshot/ Log Data
1). Data Logs
Monitoring data can be saved in two formats for later review: Snapshots and Logs.
- Snapshots capture a single instance of all selected parameters at a specific moment.
- Logs record continuous data for each selected parameter while logging is active.
Logging Data
- A) Configure the Monitor/Logger settings.
Note: Parameters can be added or removed from the Selected Parameters list even while logging is active. - B) Start logging data using one of the following methods:
- Right-click anywhere in the Selected Parameters list and choose Log Data from the menu.
- Click the Log Data icon on the toolbar.
- Navigate to Tools > Data Monitor/Logger > Log Data in the menu bar.
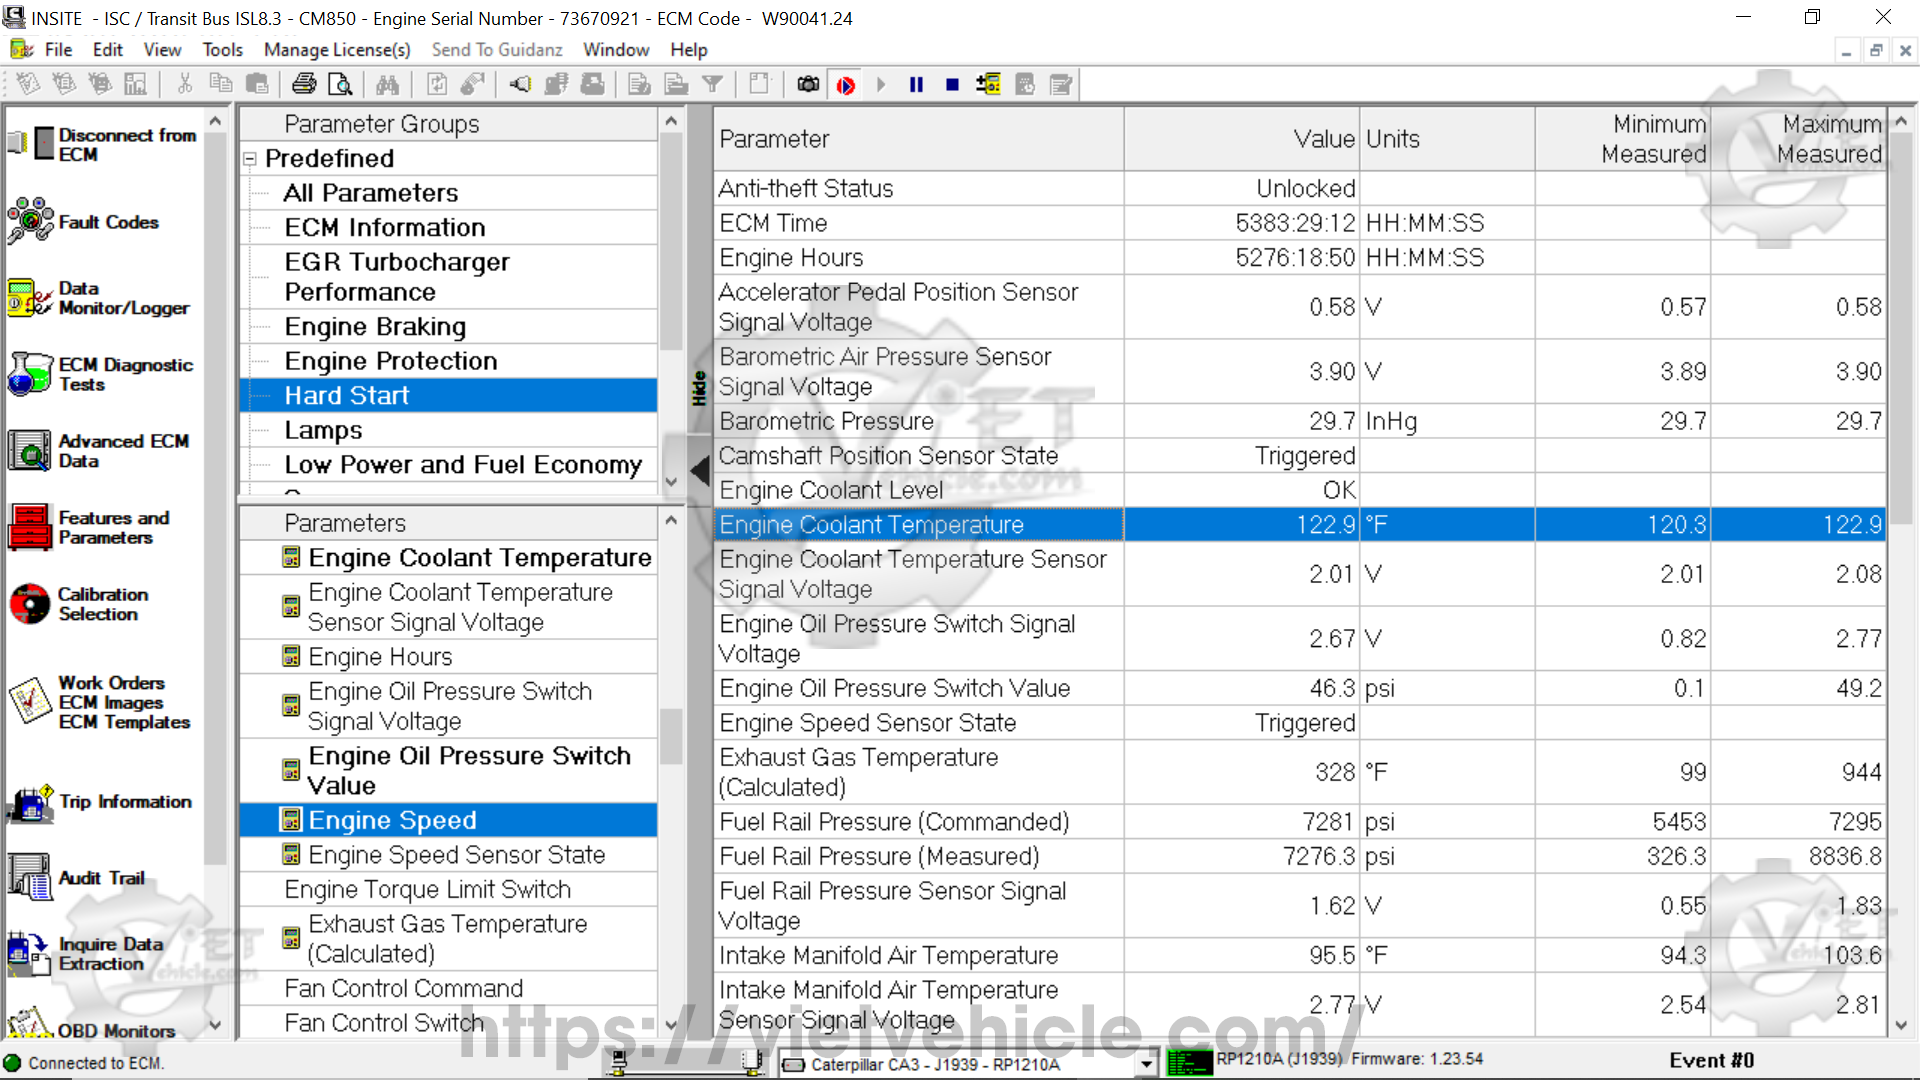
Figure 1.10 – Event #0 (Logging Data)
- C) Once logging begins, the selected parameters will update at the specified sampling rate, and an animated scrolling icon will appear in the status bar.
- Start/Resume – Starts monitoring/logging if it has not yet begun. If previously paused, selecting this option resumes the process.
- Pause – Temporarily halts monitoring or logging.
- Stop – Ends the monitoring or logging session.
- D) When the Stop command is selected, parameter updates will cease, the scrolling icon in the status bar will disappear, and the Save Logged Data window will appear.
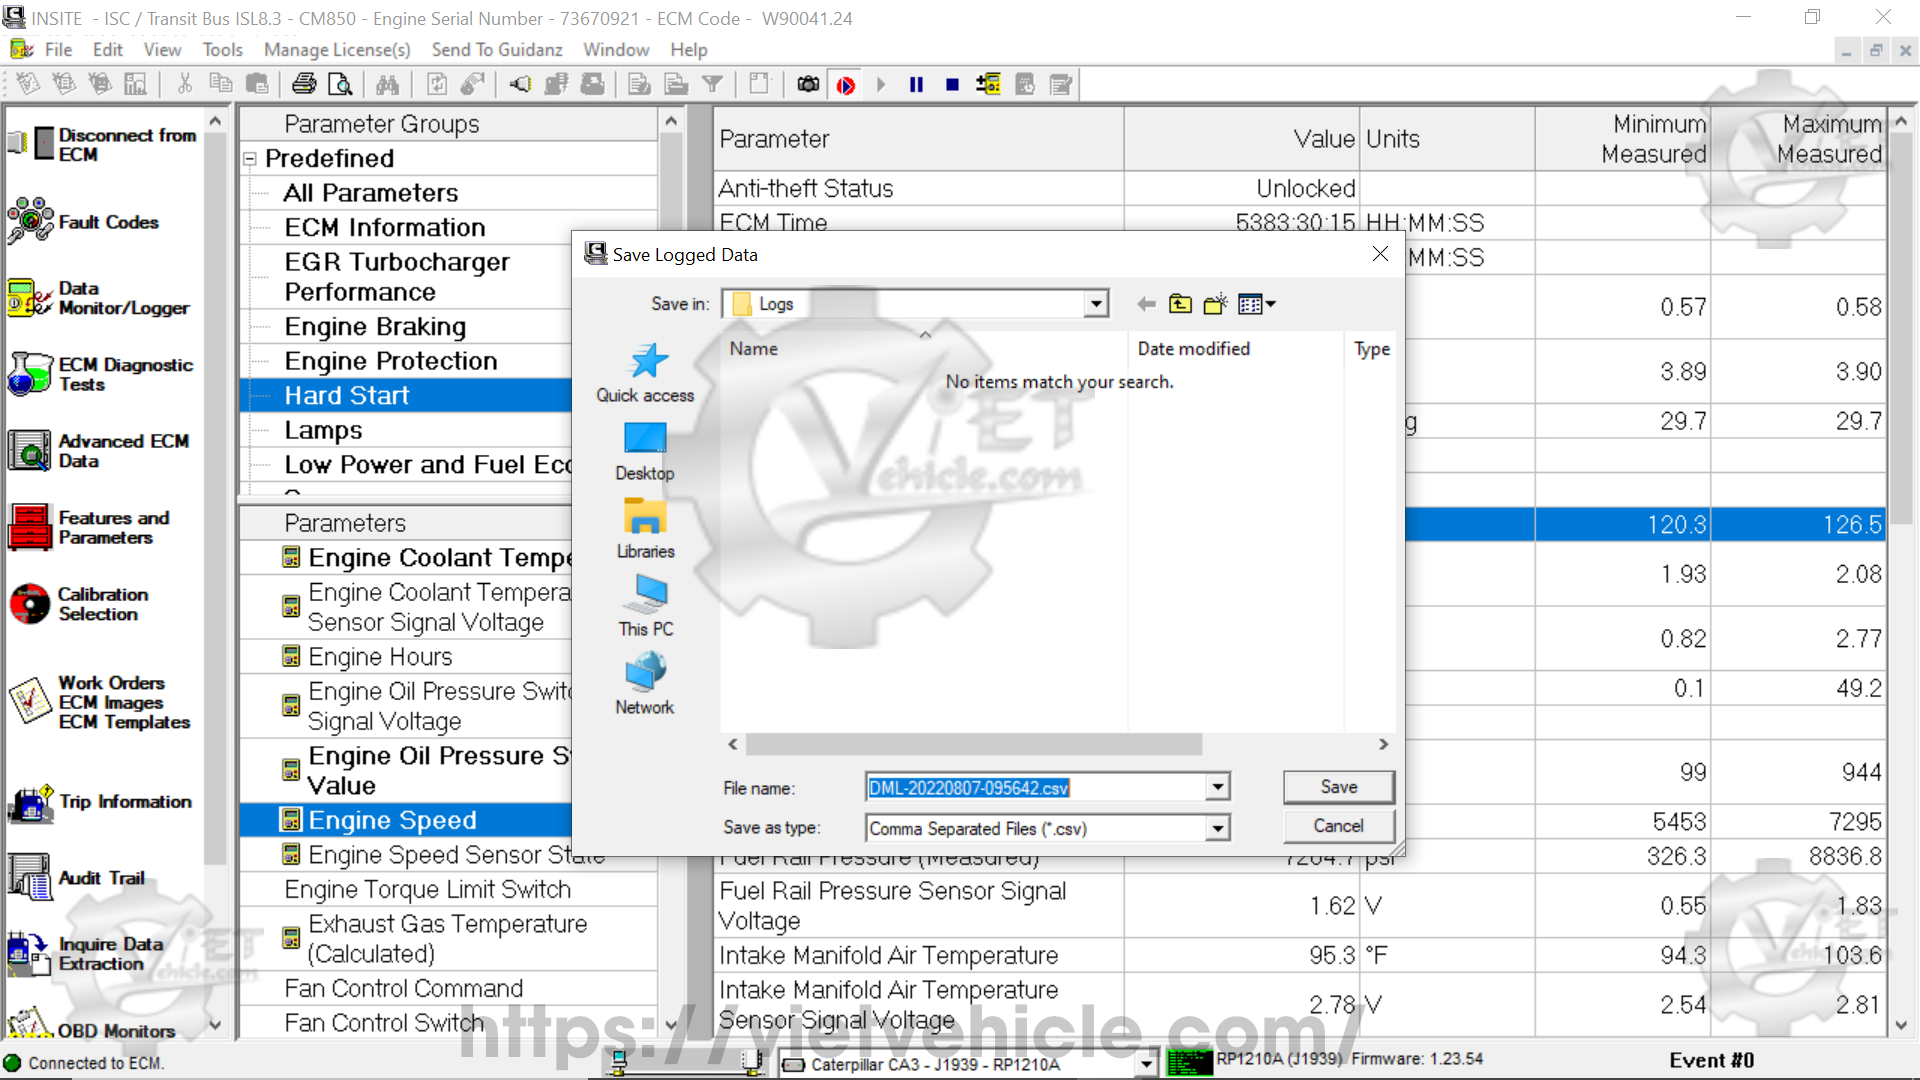
Figure 1.11 – Save Logged Data
- E) Choose the file location, name, and format, or accept the default settings.
Note: The default file name starts with the username (if User Manager is enabled) or “DML-” (if User Manager is disabled), followed by the timestamp of when the snapshot was taken.
Example: DML-20200806-135109 indicates the file was created at 1:51:09 PM on August 6, 2020. - F) Click Save and enter log file comments if needed. The saved log file can be opened using any third-party software that supports the selected format.
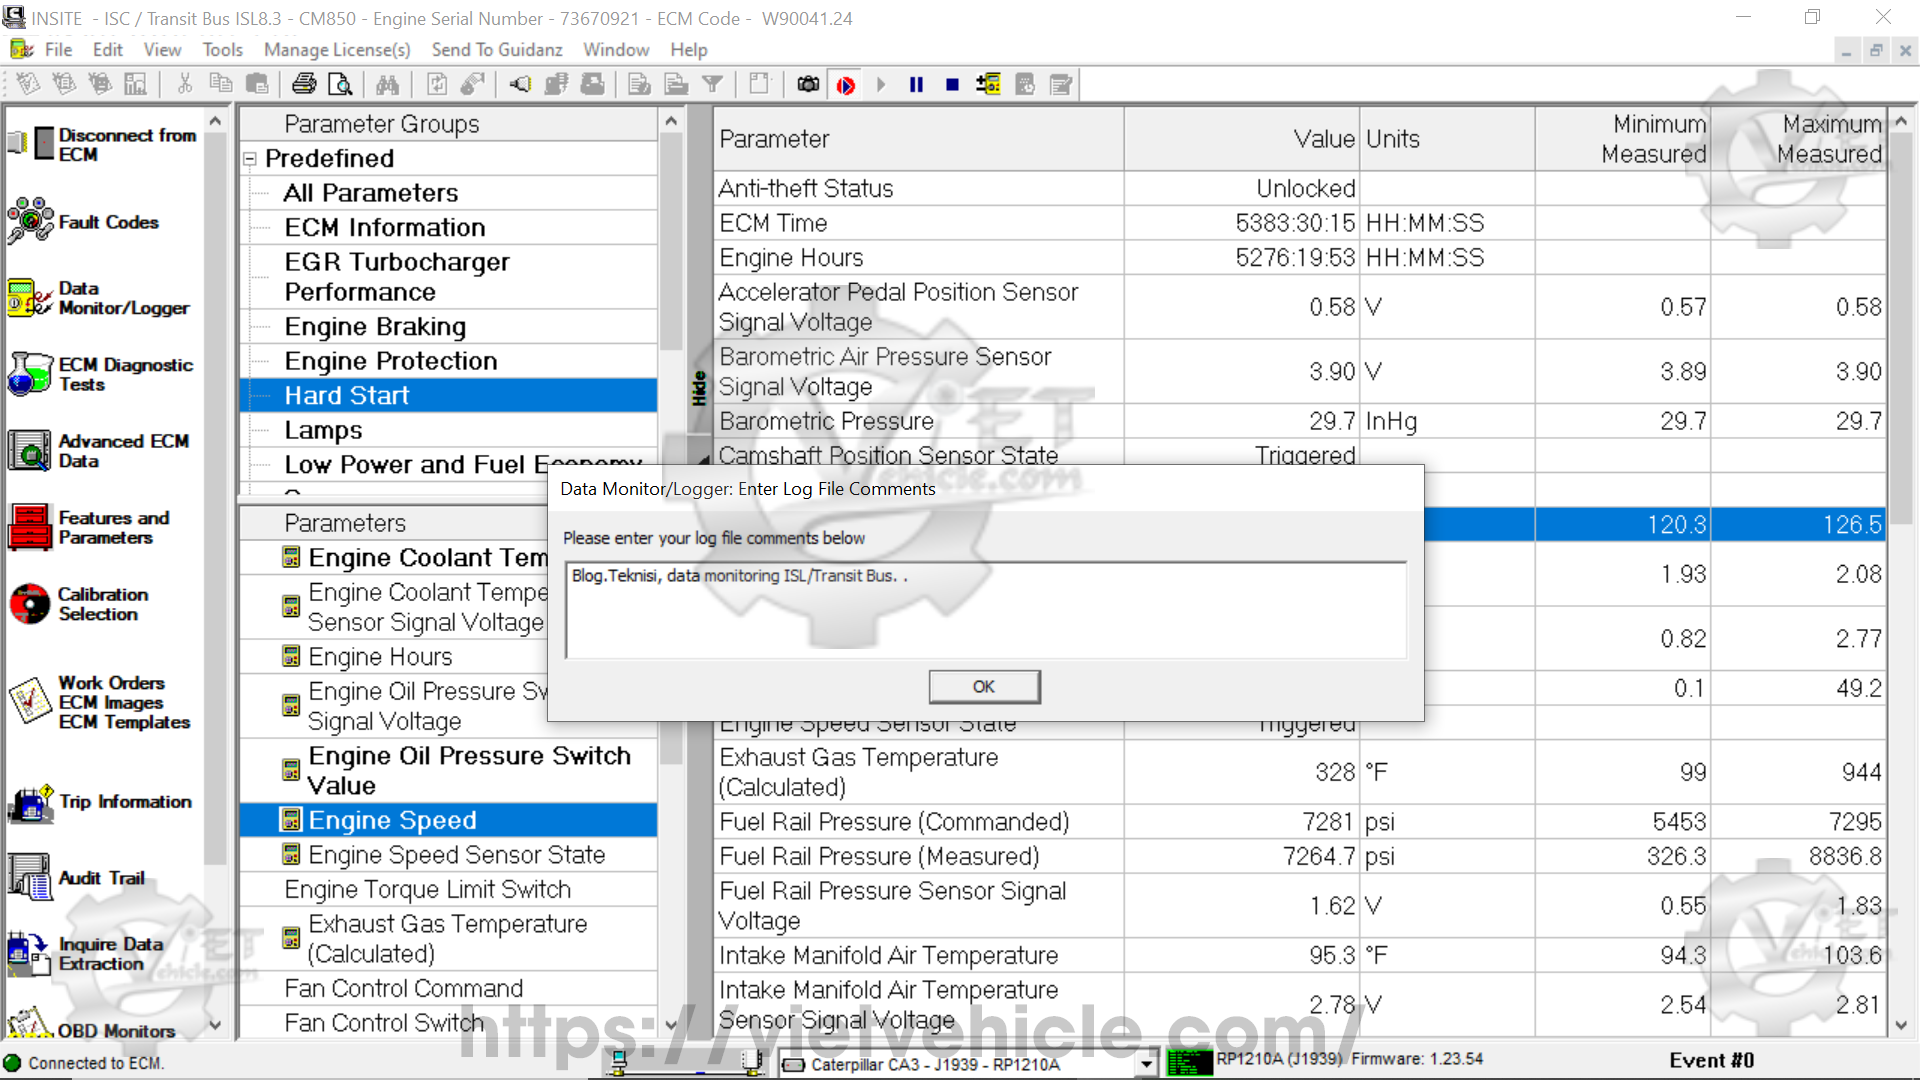
Figure 1.12 – Enter Log File Comments
G). Find the saved file on Local Disk (C:)\Intelect\INSITE\Logs (DML-20200807-095509.csv).
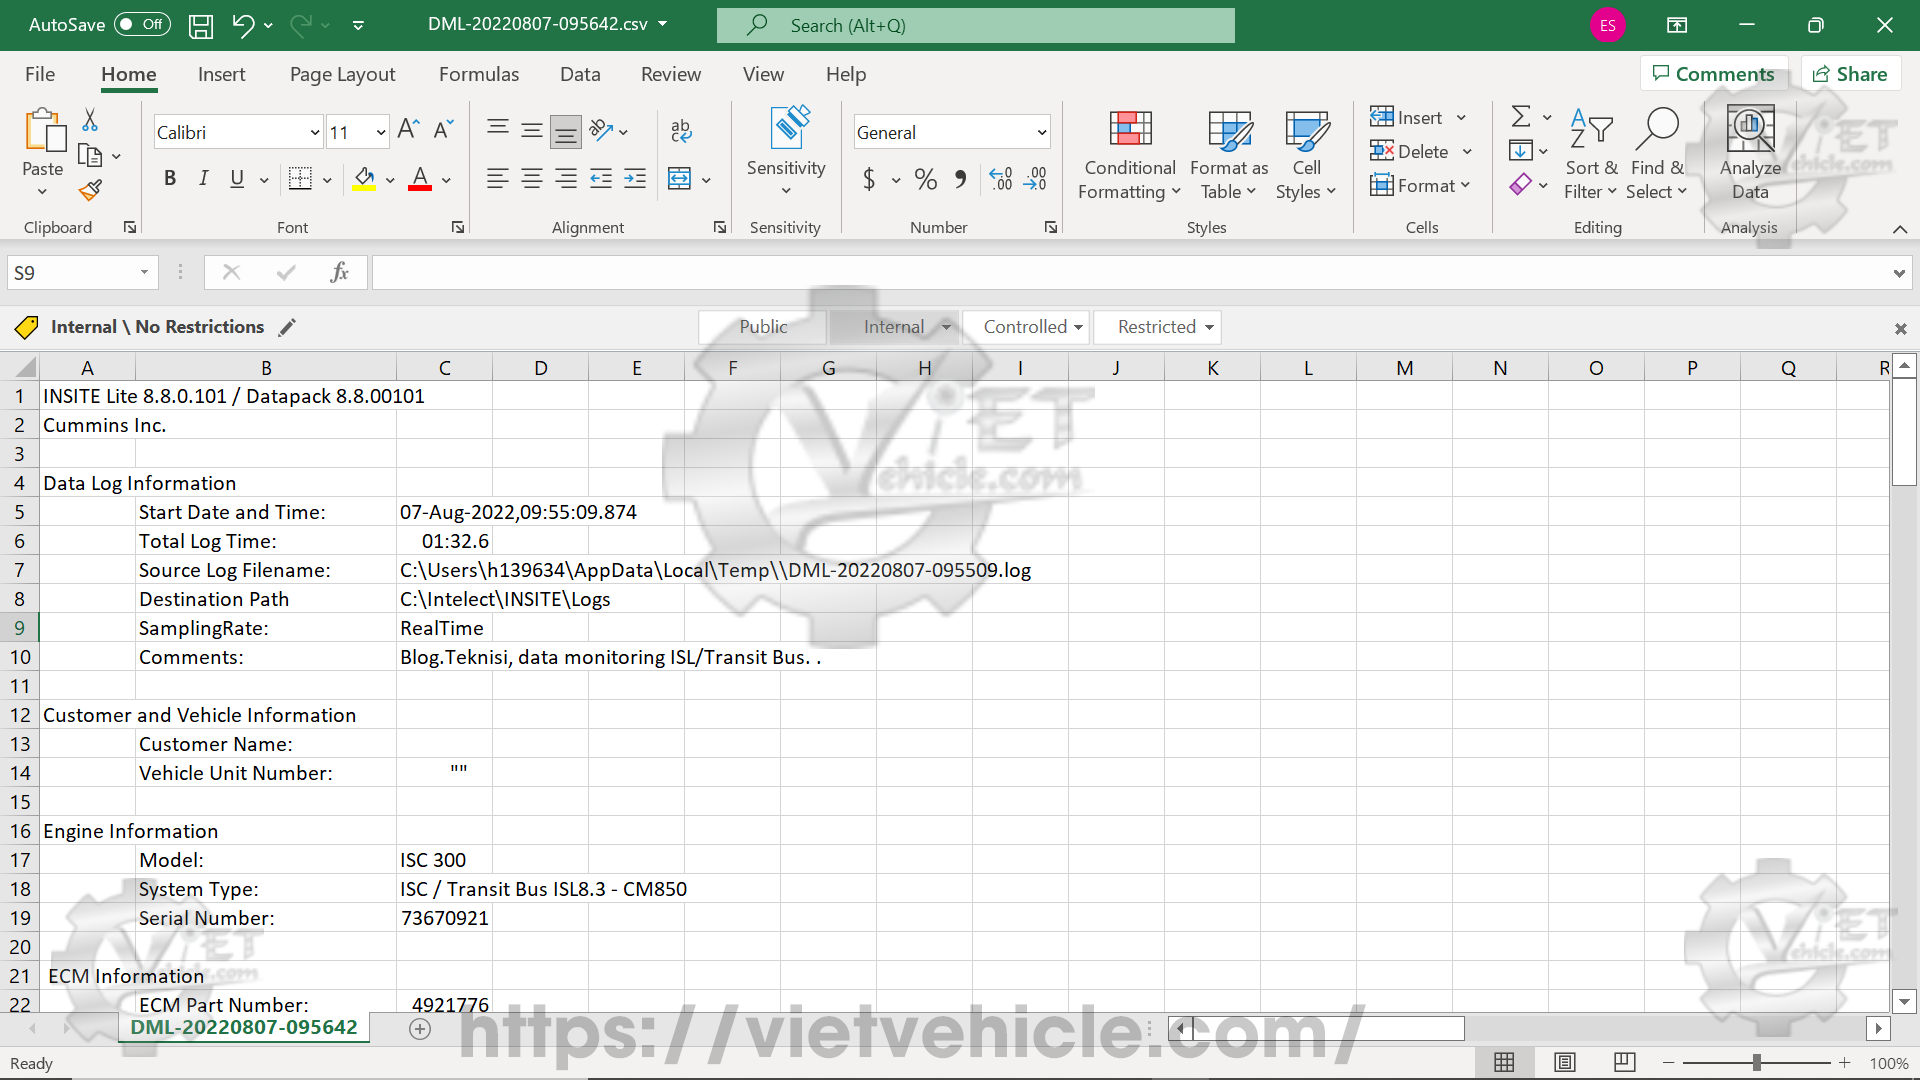
Figure 1.13 – Logs (DML-20200807-095509.csv)
2). Snapshots
A snapshot is a single recorded instance of all selected parameters at a specific moment. Snapshots can be captured at any time while monitoring or logging is active or paused. However, they can only be taken while the Data Monitor/Logger window is open.
Capturing a Snapshot
- A) Configure the Monitor/Logger
B) Ensure that monitoring or logging is currently running.
C) Capture a snapshot using one of the following methods:
- Right-click anywhere in the Selected Parameter List and choose Snapshot from the menu.
- Click the Snapshot icon in the toolbar.
- Navigate to Tools > Data Monitor/Logger > Snapshot from the menu bar.
D) The Save Snapshot Data pop-up window will appear.
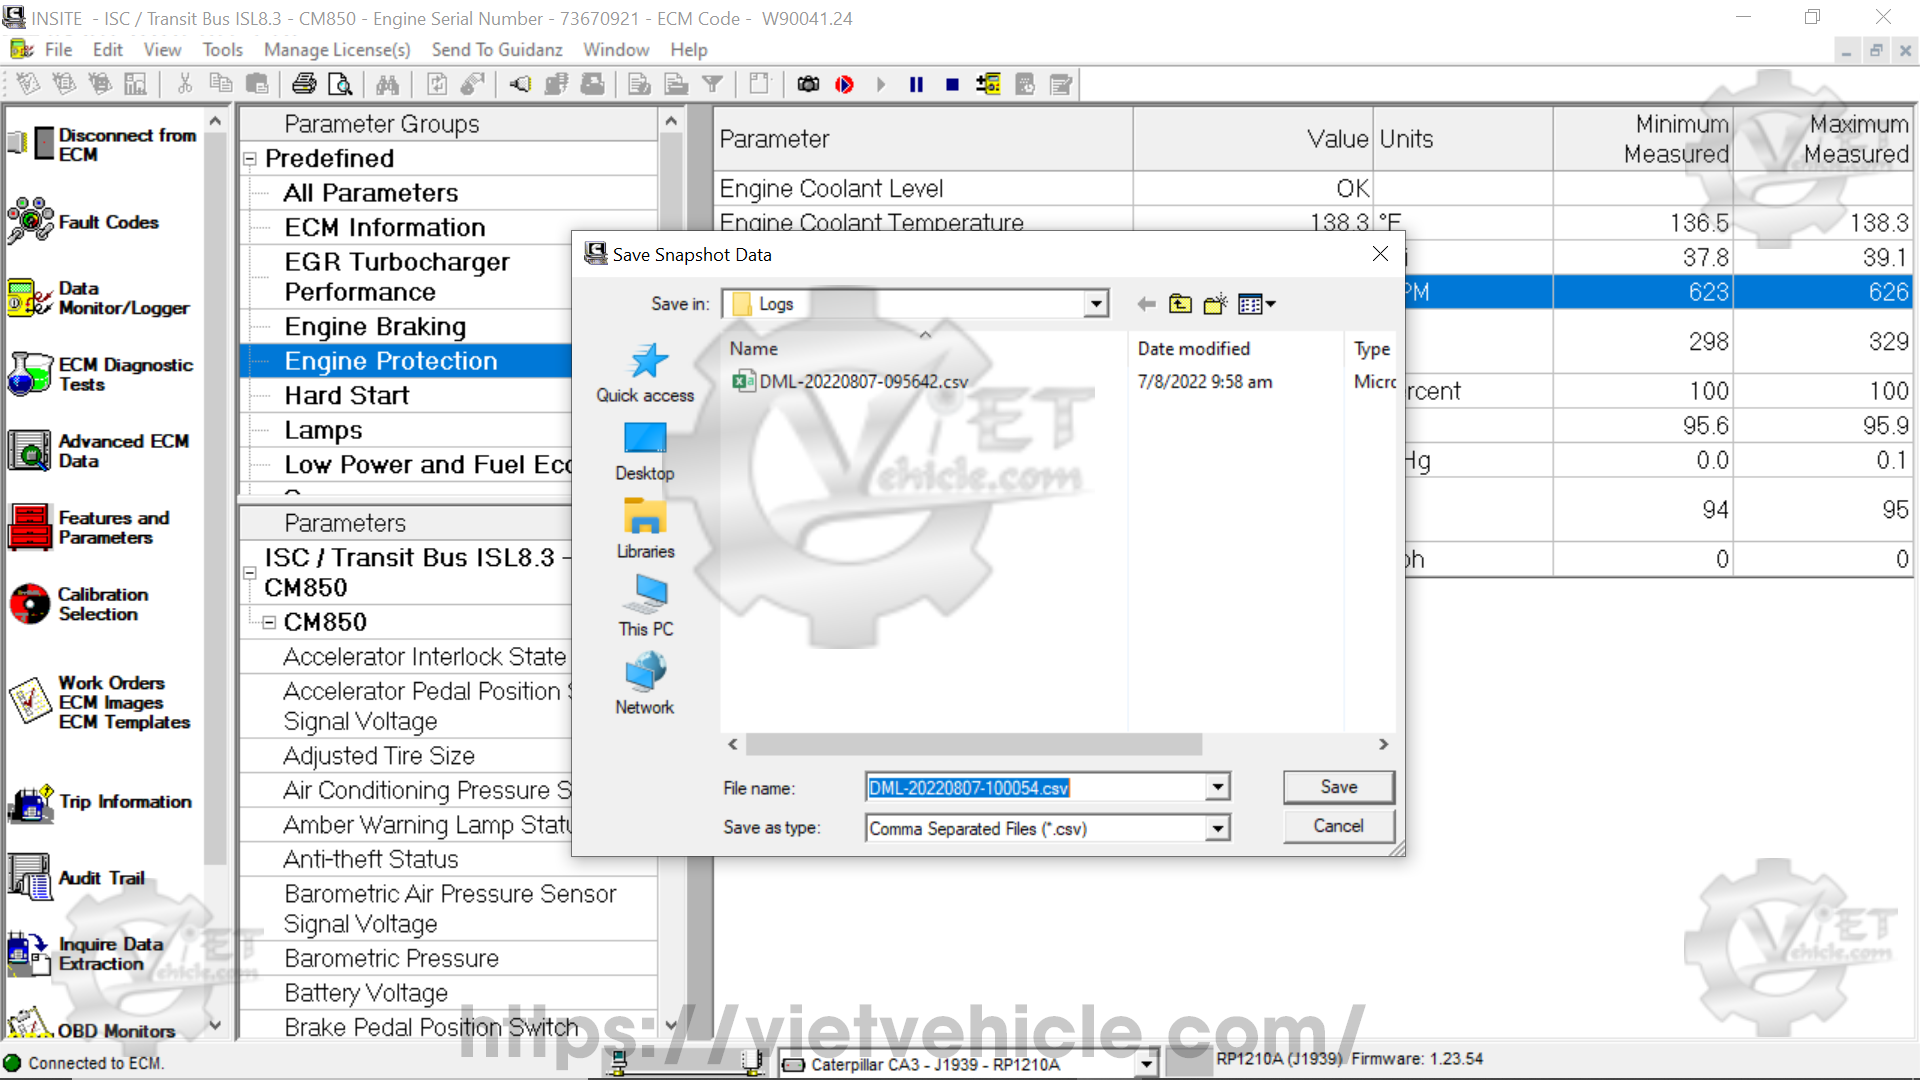
Figure 1.14 – Save Snapshot Data
- E) Choose a file location, name, and format, or use the default settings.
Note: The default file name follows this format:
- If User Manager is enabled: the file starts with the username.
- If User Manager is disabled: the file name begins with “DML-,” followed by the timestamp of when the snapshot was taken (year, month, day, hour, minute, second).
Example: DML-20200809-215456 was saved at 9:54:56 PM on August 9, 2020.
- F) Click Save, then enter any relevant log file comments. The saved file can be opened using any third-party software that supports the selected format.
- G) Locate the saved file in:
📂 Local Disk (C:) > Intelect > INSITE Logs (Example: DML-20200807-100054.csv).
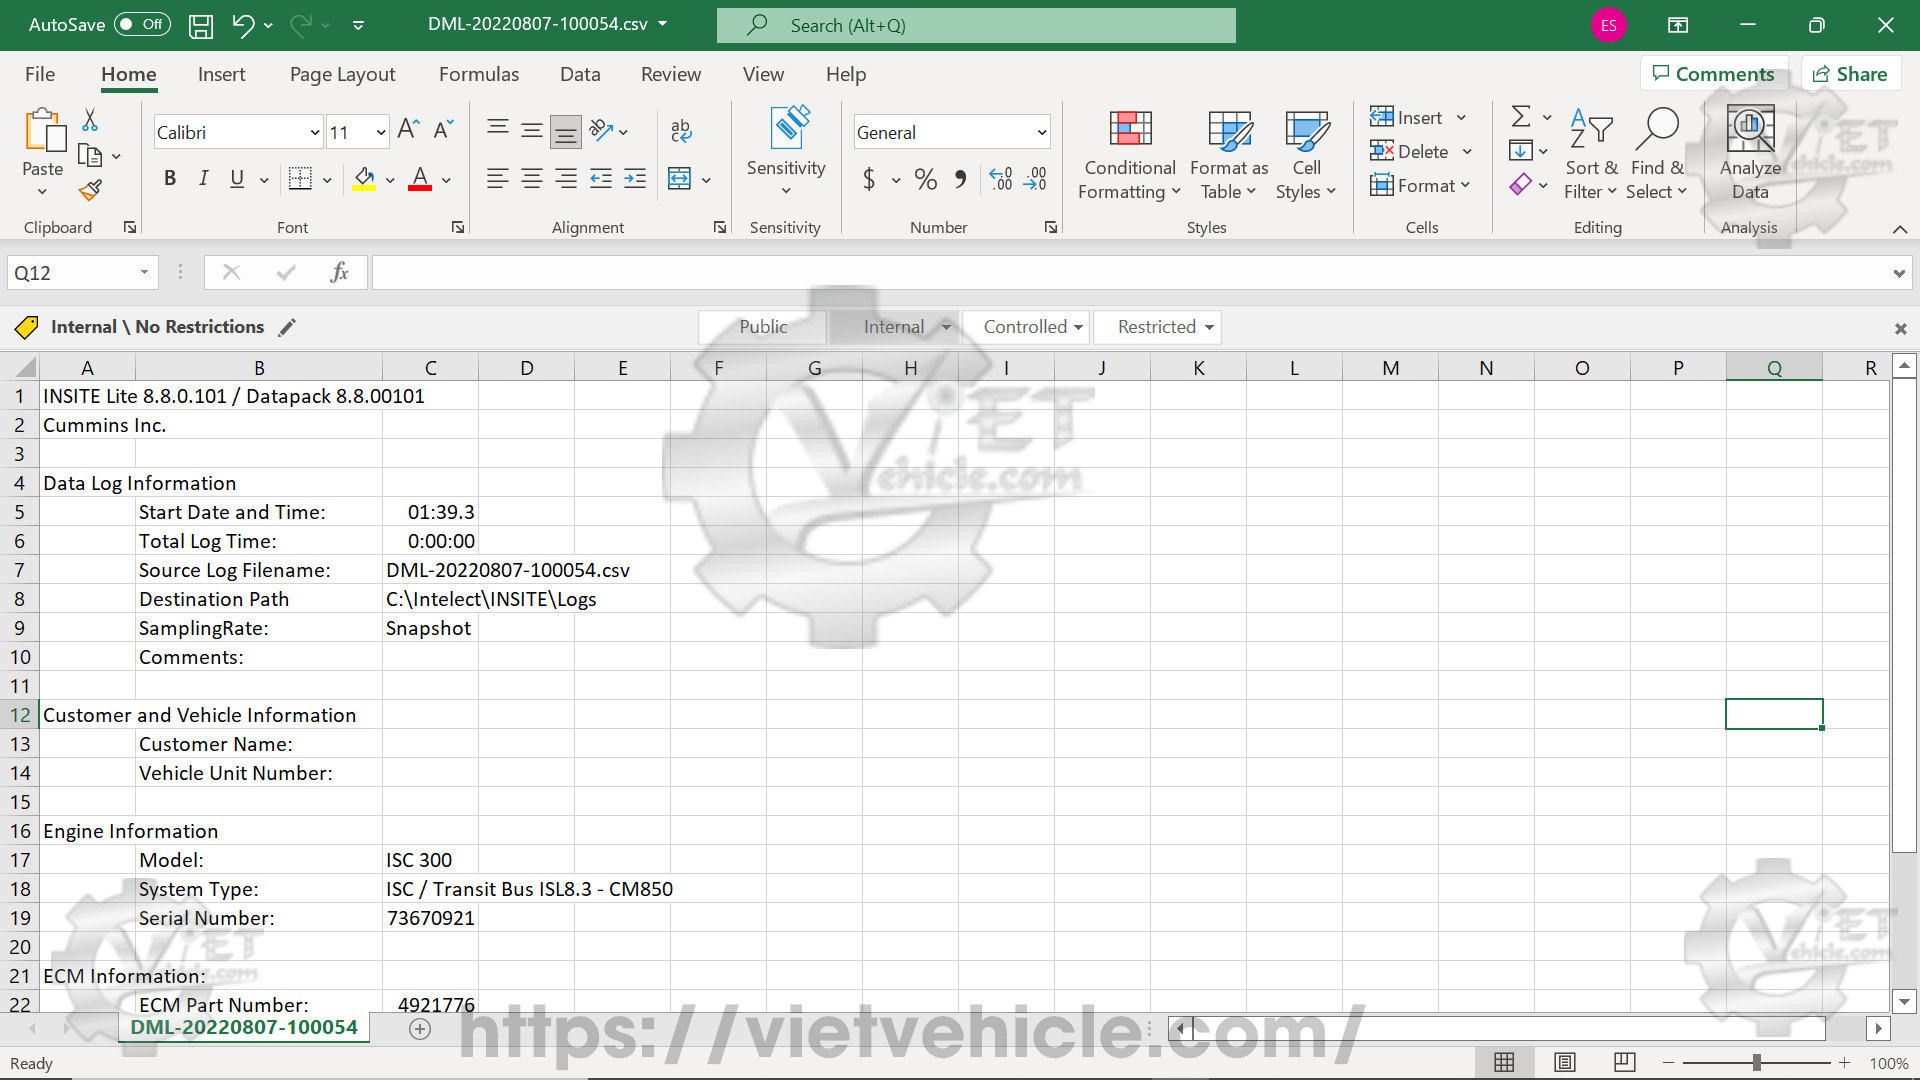
Figure 1.15 – Logs (DML-20200807-100054.csv)
Contact Us
Whatsapp: +84.858.966.333
Facebook: VIETVehicle Remote Delete Service
YouTube: VIETVehicle – ECM Delete Tuning
Tiktok: VIETVehicle.com
Website: VIETVehicle.com


