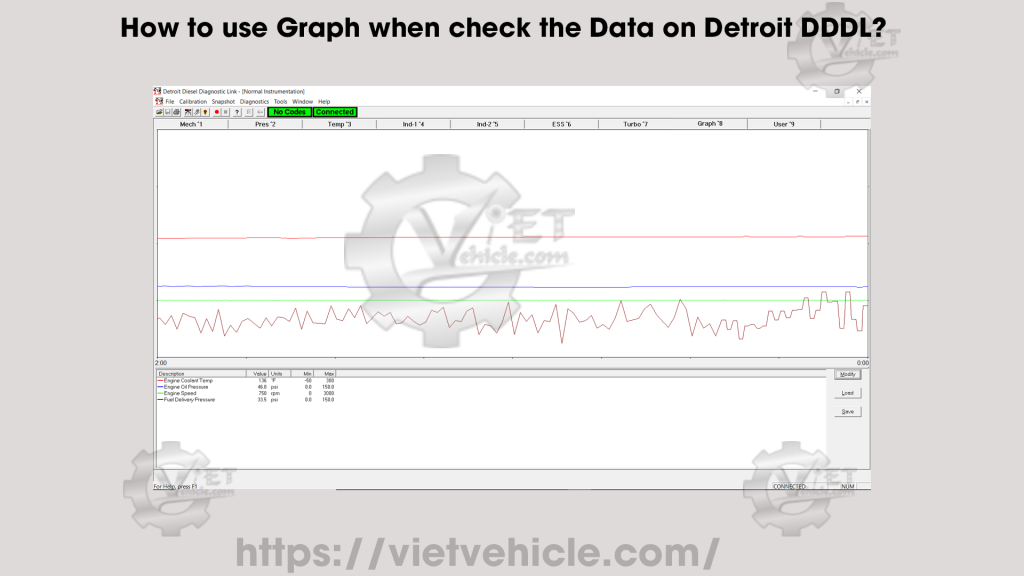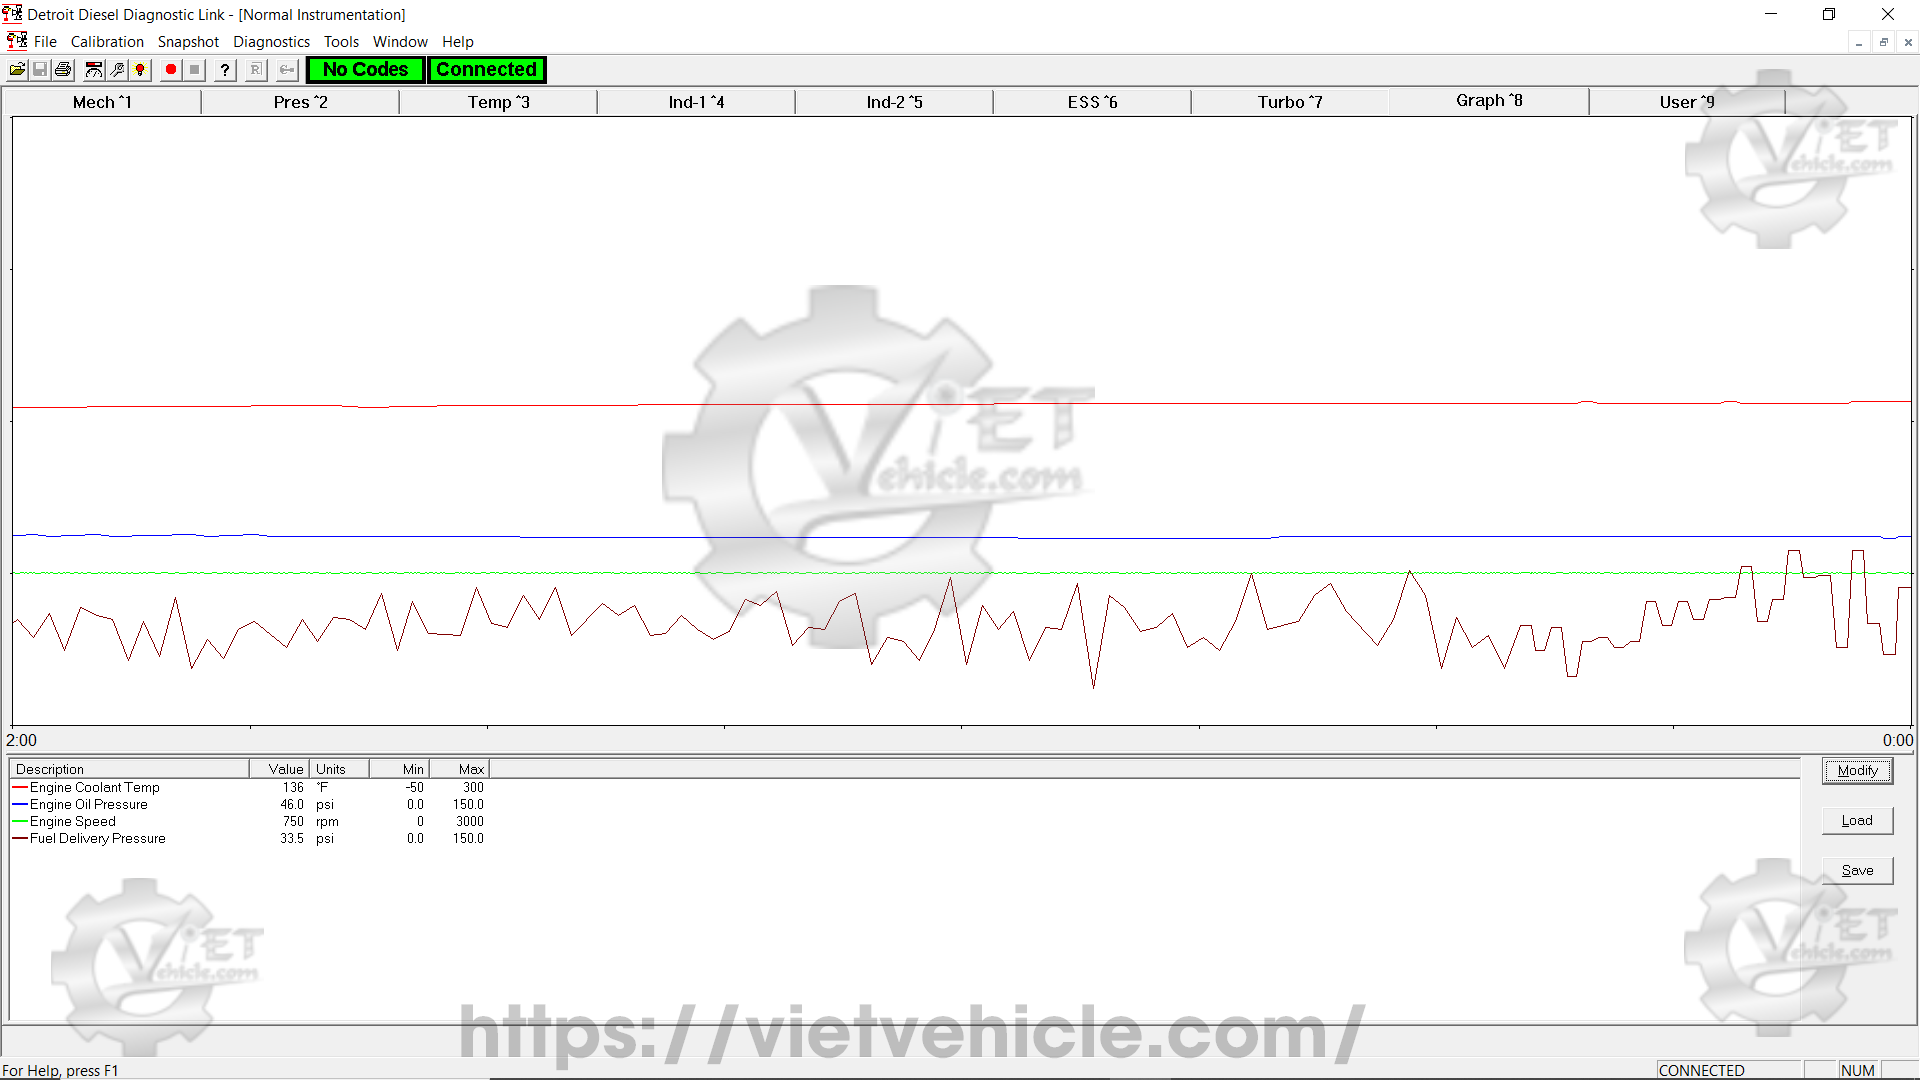
Figure 1.1 – Graph (Normal Instrumentation)
Accessing the Graph Page on DDDL
- Connect the Detroit Engine (Series 60) using DDDL Software (v6.50). Read More: [How to Connect DETROIT Engines using Detroit Diesel Diagnostic Link (DDDL)]
- Choose Normal Instrumentation or Diagnostic Instrumentation from the Diagnostics menu. Read More: [Normal Instrumentation using Detroit Diesel Diagnostic Link (DDDL) Software]
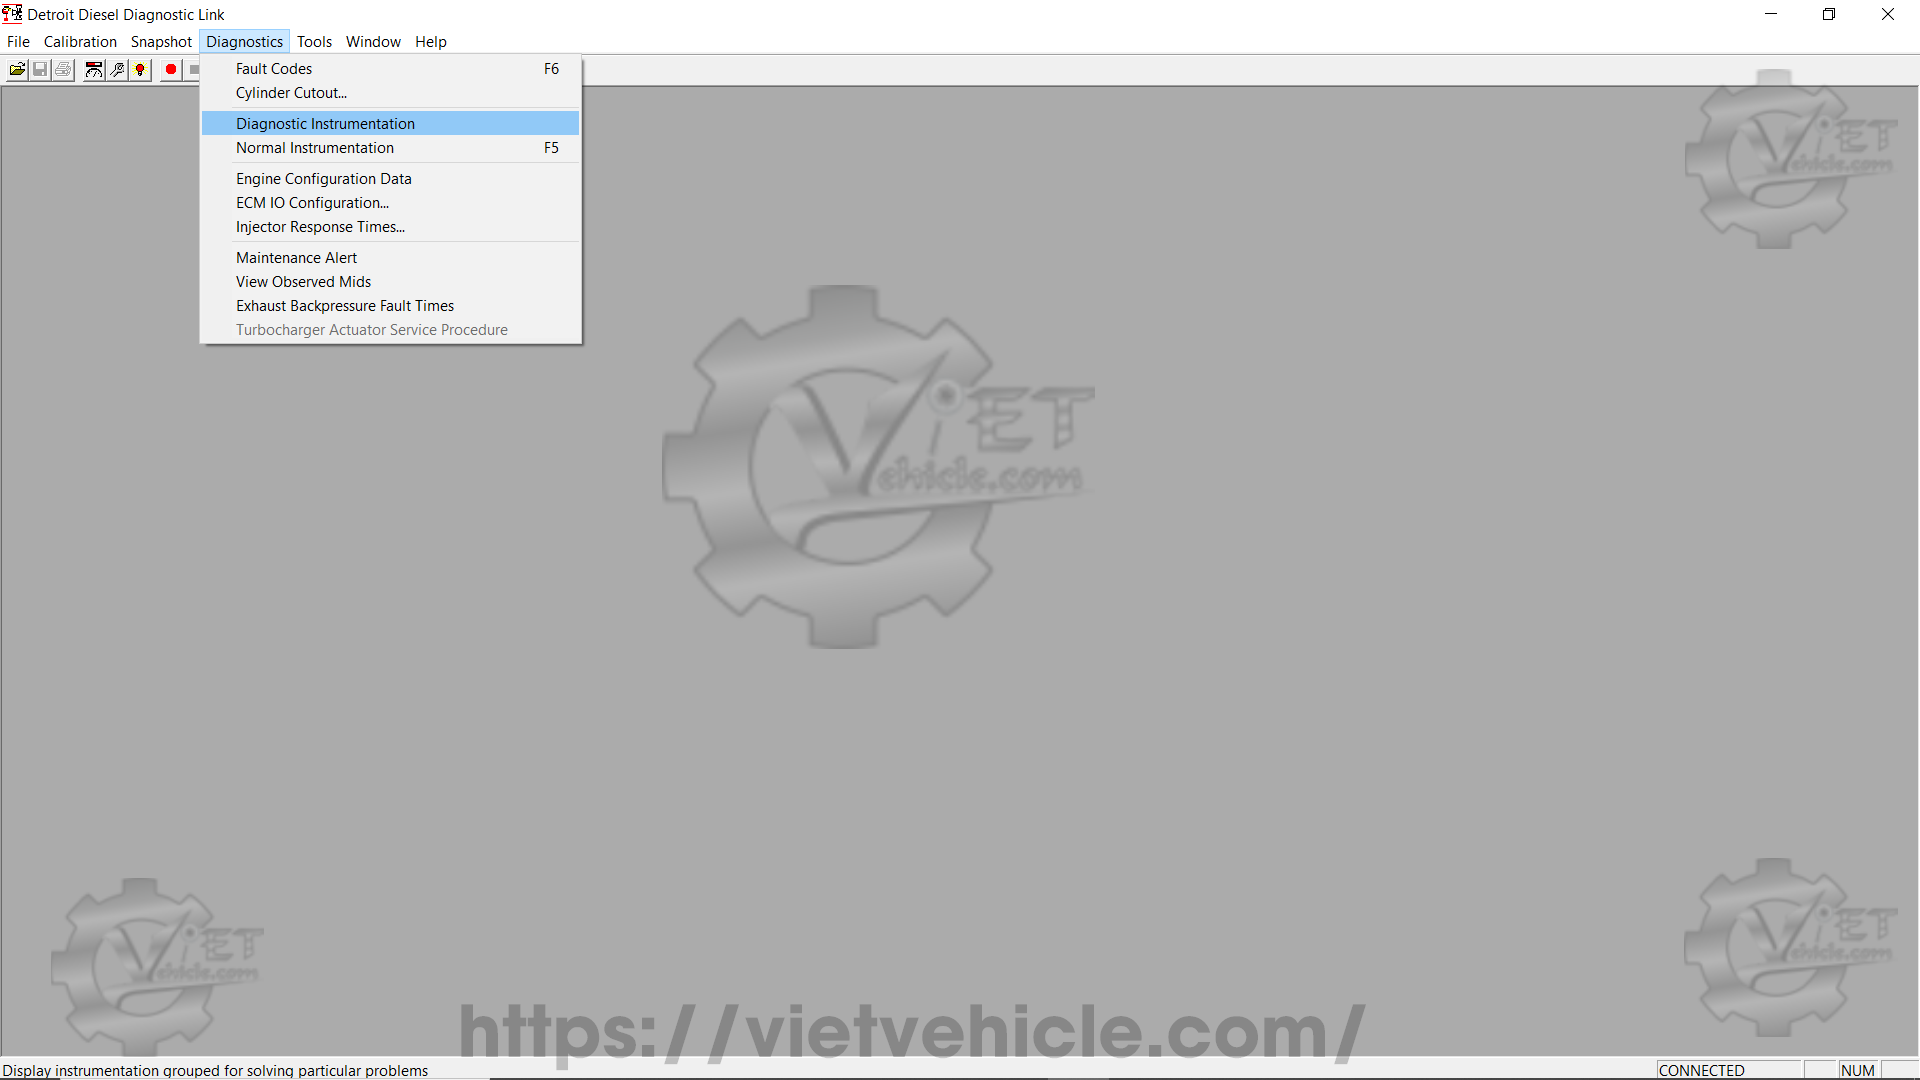
Figure 1.2 – Diagnostics (Normal Instrumentation)
- Click on the Graph tab in the Instrumentation window to display the Graph page. The Graph page allows you to display traces showing the variation of selected measurements over time. The traces are:
- Automatically scaled
- Color-coded for identification based on the Description section at the bottom of the Graph page
- Set to scroll when reaching the left-hand edge of the Graph window (after two minutes), ensuring that the window always displays the last two minutes of measurement results.
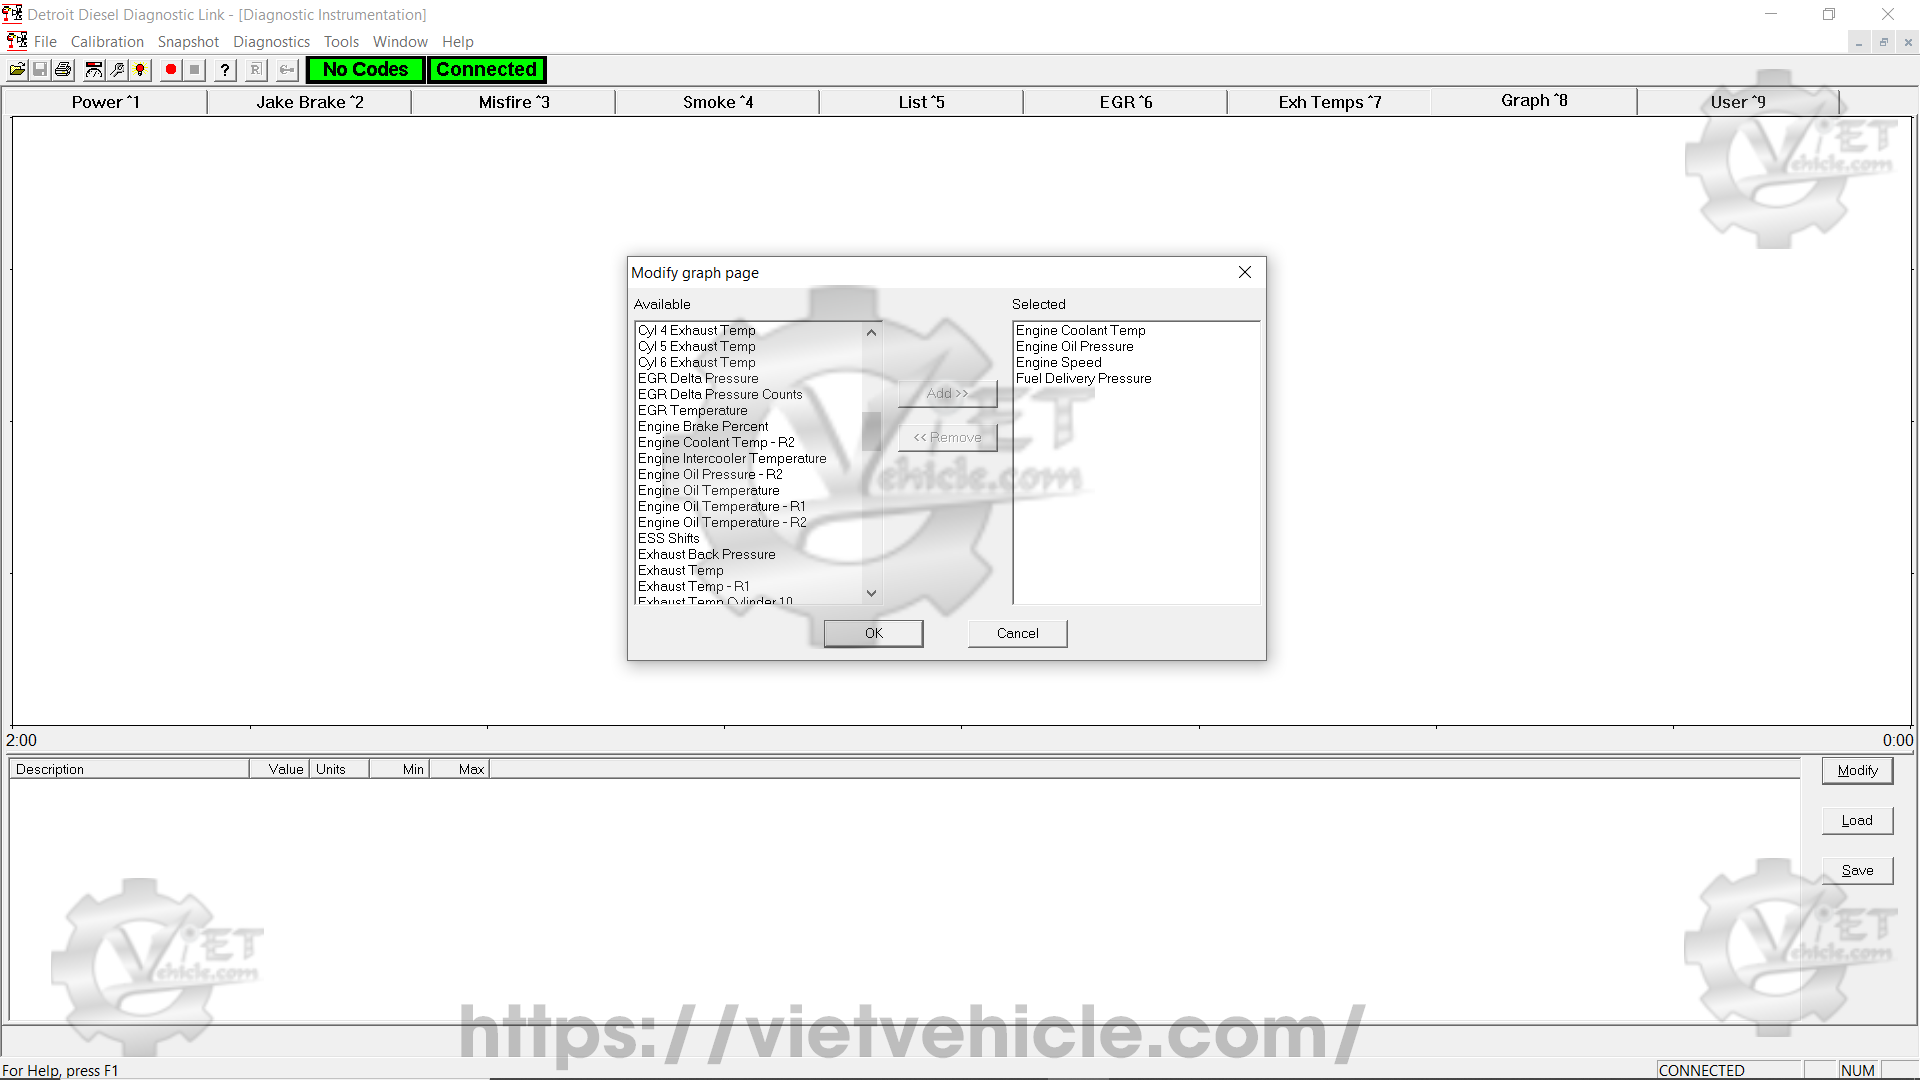
Figure 1.3 – Modify Graph Page (1)
Selecting or Changing Measurements to Trace
- Click Modify to open the Modify Graph Page dialog box. The Selected list displays the currently chosen measurements for tracing.
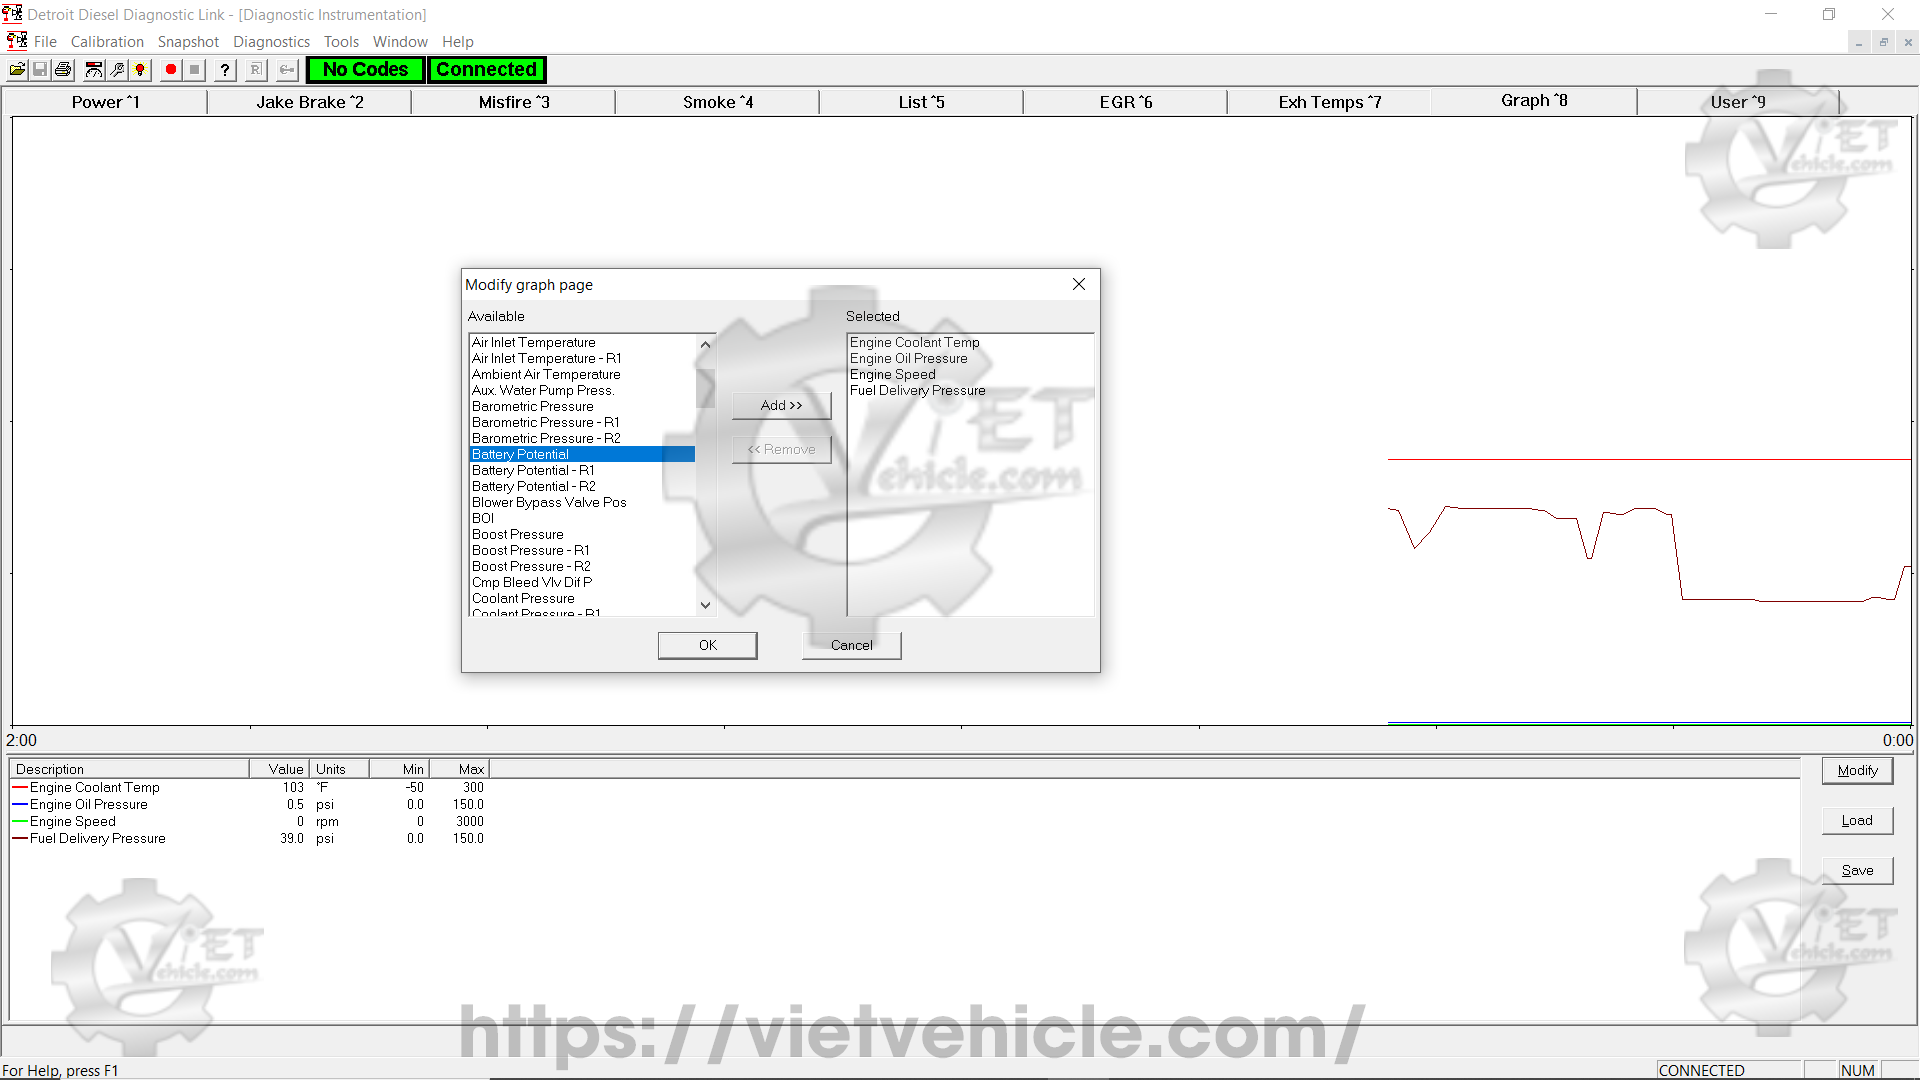
Figure 1.4 – Modify Graph Page (2)
To add or remove a measurement:
- Select the measurement from the Available list by clicking on it.
- Click Add >> to include it or << Remove to exclude it.
- Click OK to confirm the updated list of measurements to be traced in the Graph page.
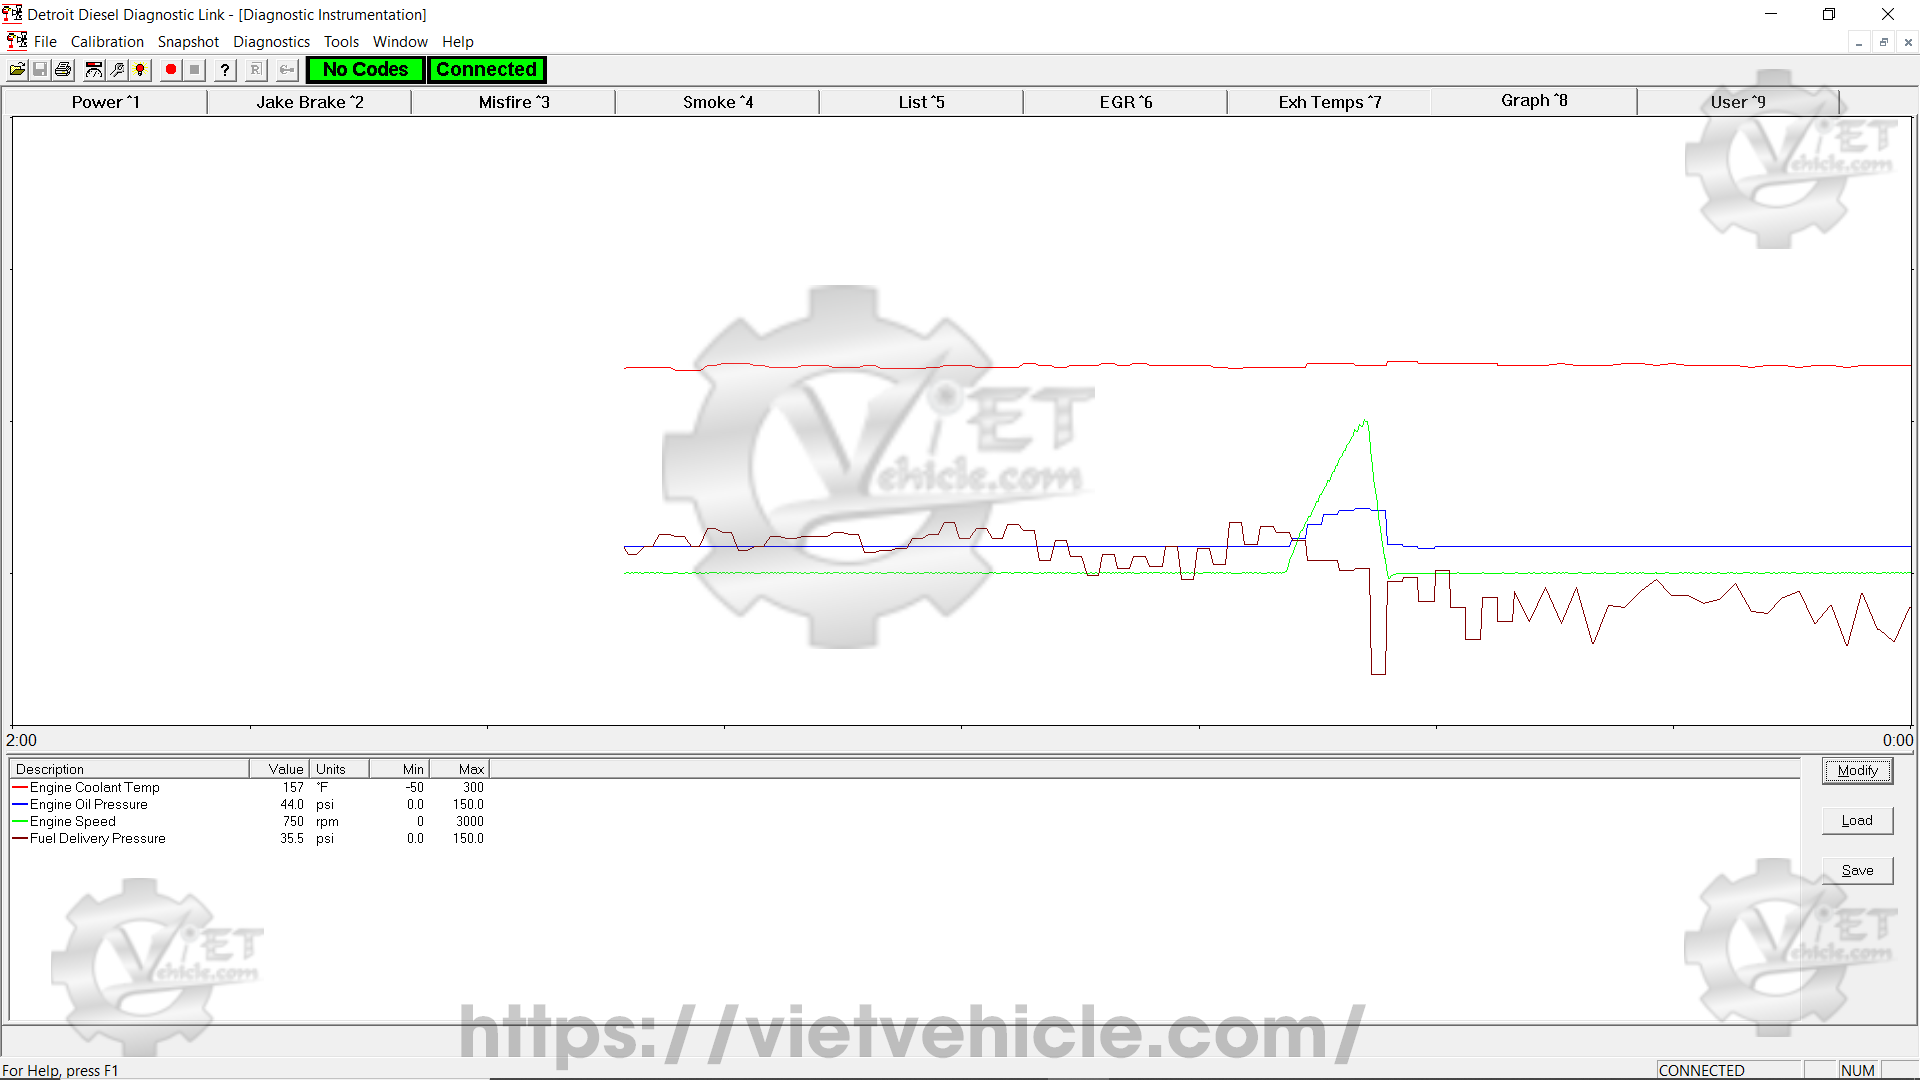
Figure 1.5 – Graph (1)
Once the Modify Graph Page dialog box is closed:
- The selected measurements appear in the box at the bottom of the Graph page.
- The current values of these measurements are displayed and continuously traced in the Graph window.
Saving the Current Graph Page Settings
To save the current Graph page settings as a file:
- Click Save to open the Save Graph Page Settings As dialog box.
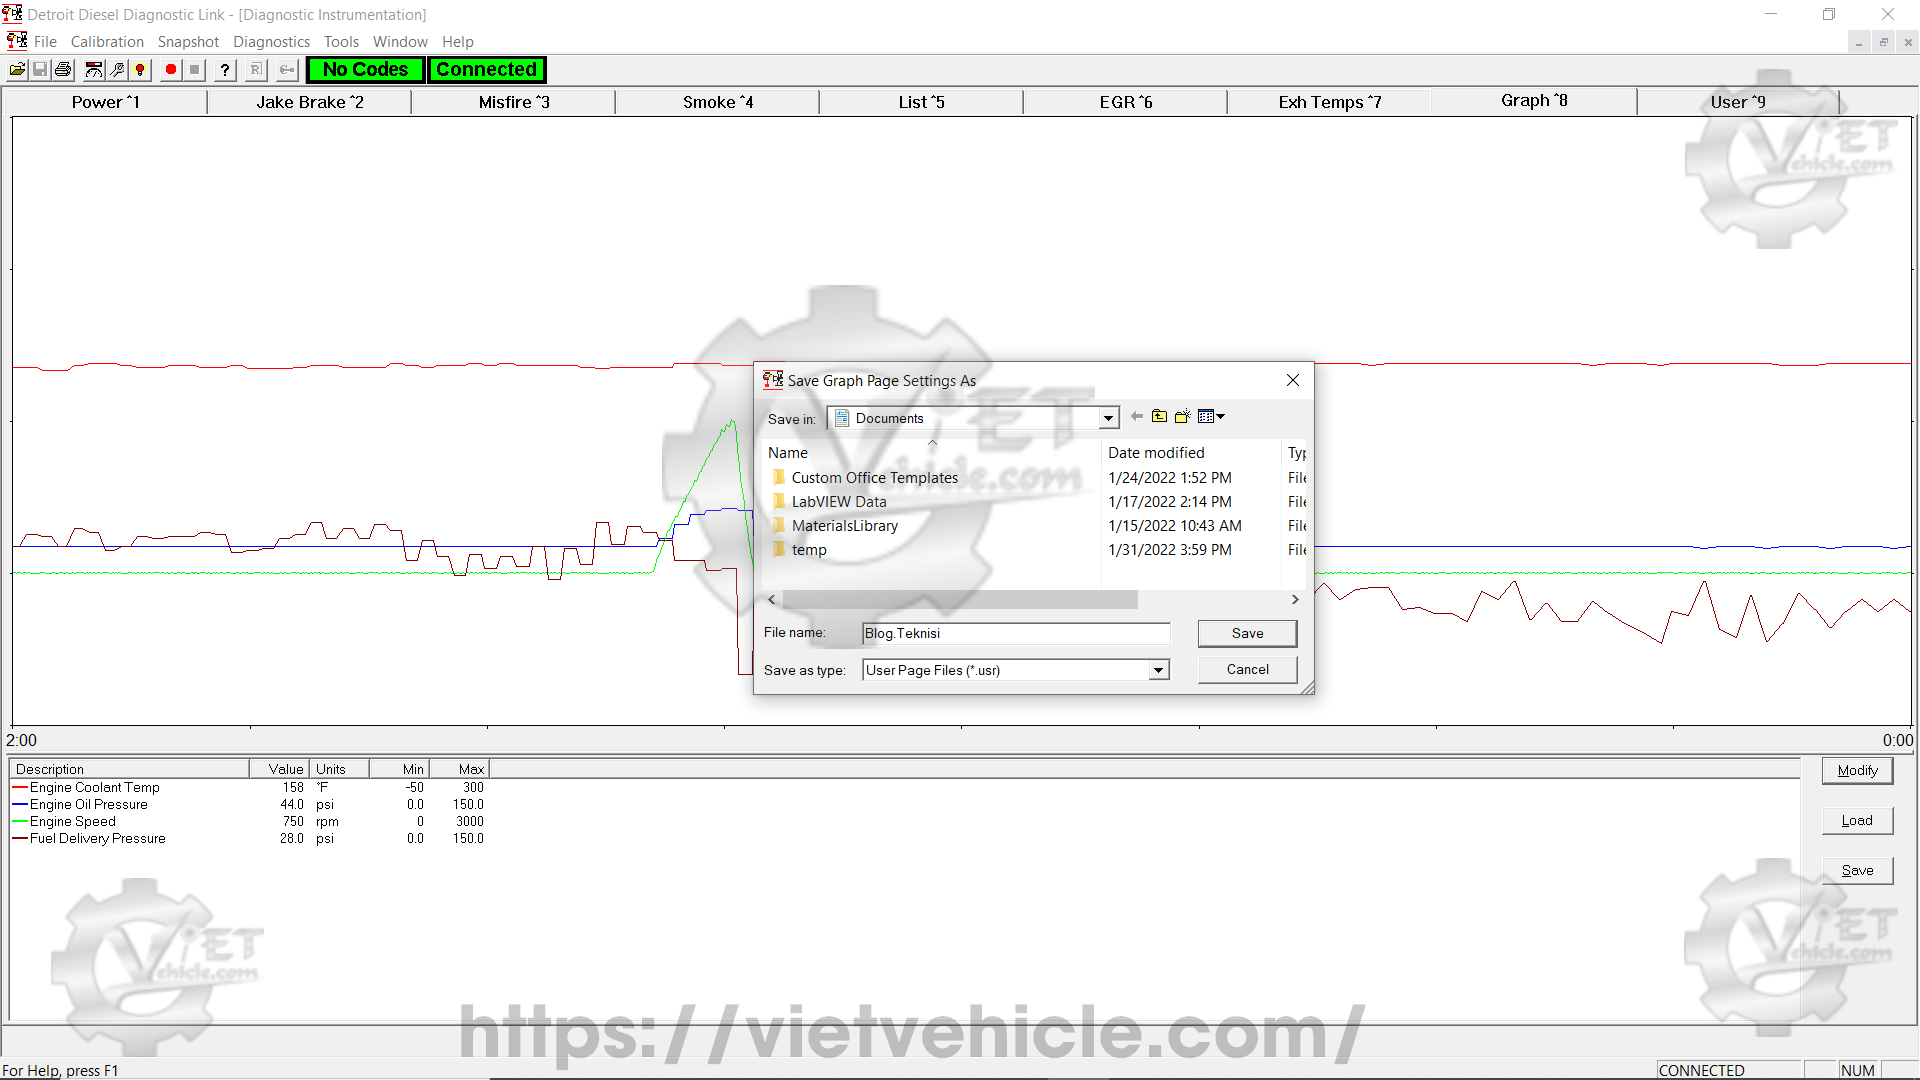
Figure 1.6 – Save Graph Page Settings As
- Select the desired folder to save the file.
- Enter a File Name for the saved settings.
- Click Save to store the file and close the dialog box.
Loading Previously Saved Graph Page Settings
To load a saved set of Graph page settings:
- Click Load to open a standard Windows Open dialog box.
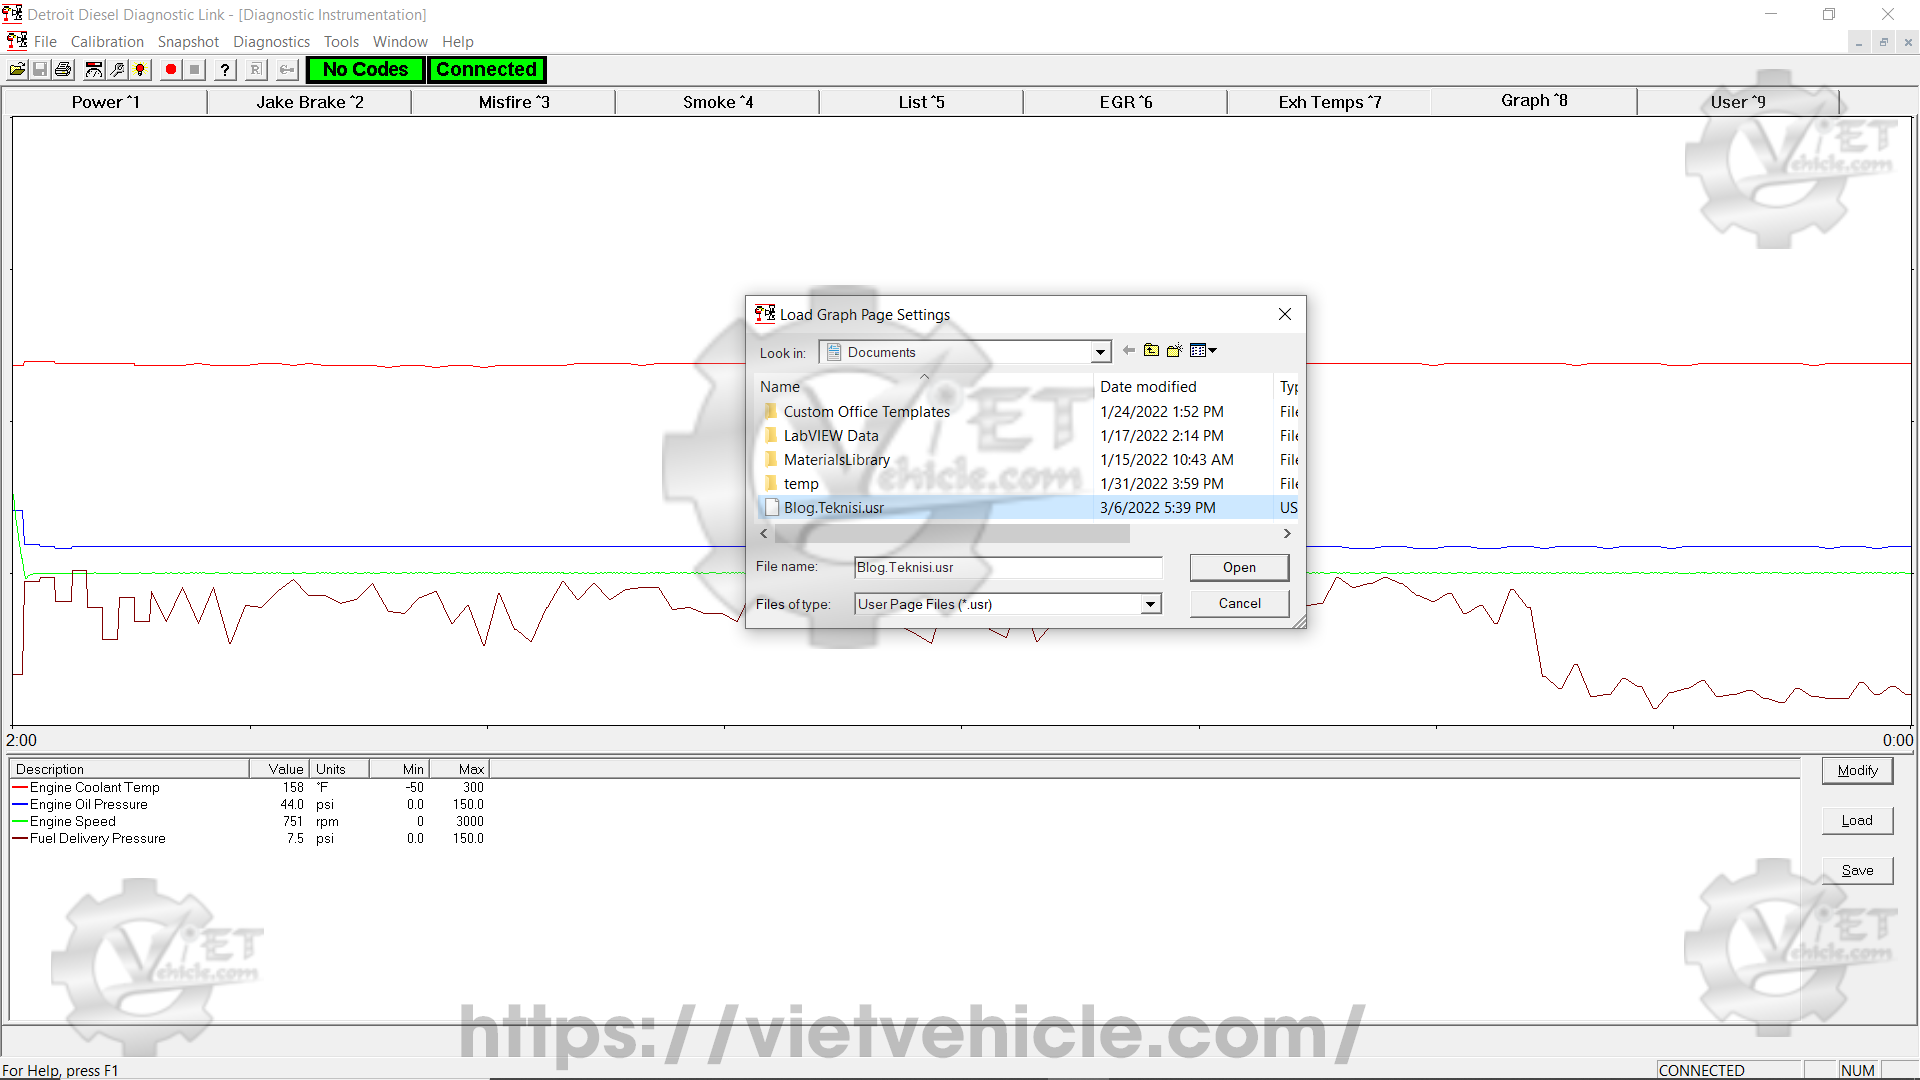
Figure 1.7 – Load Graph Page Settings
- Use the dialog box to navigate to the folder containing the required file.
- Click on the File Name to select it.
- Click Open to load the settings and close the dialog box.
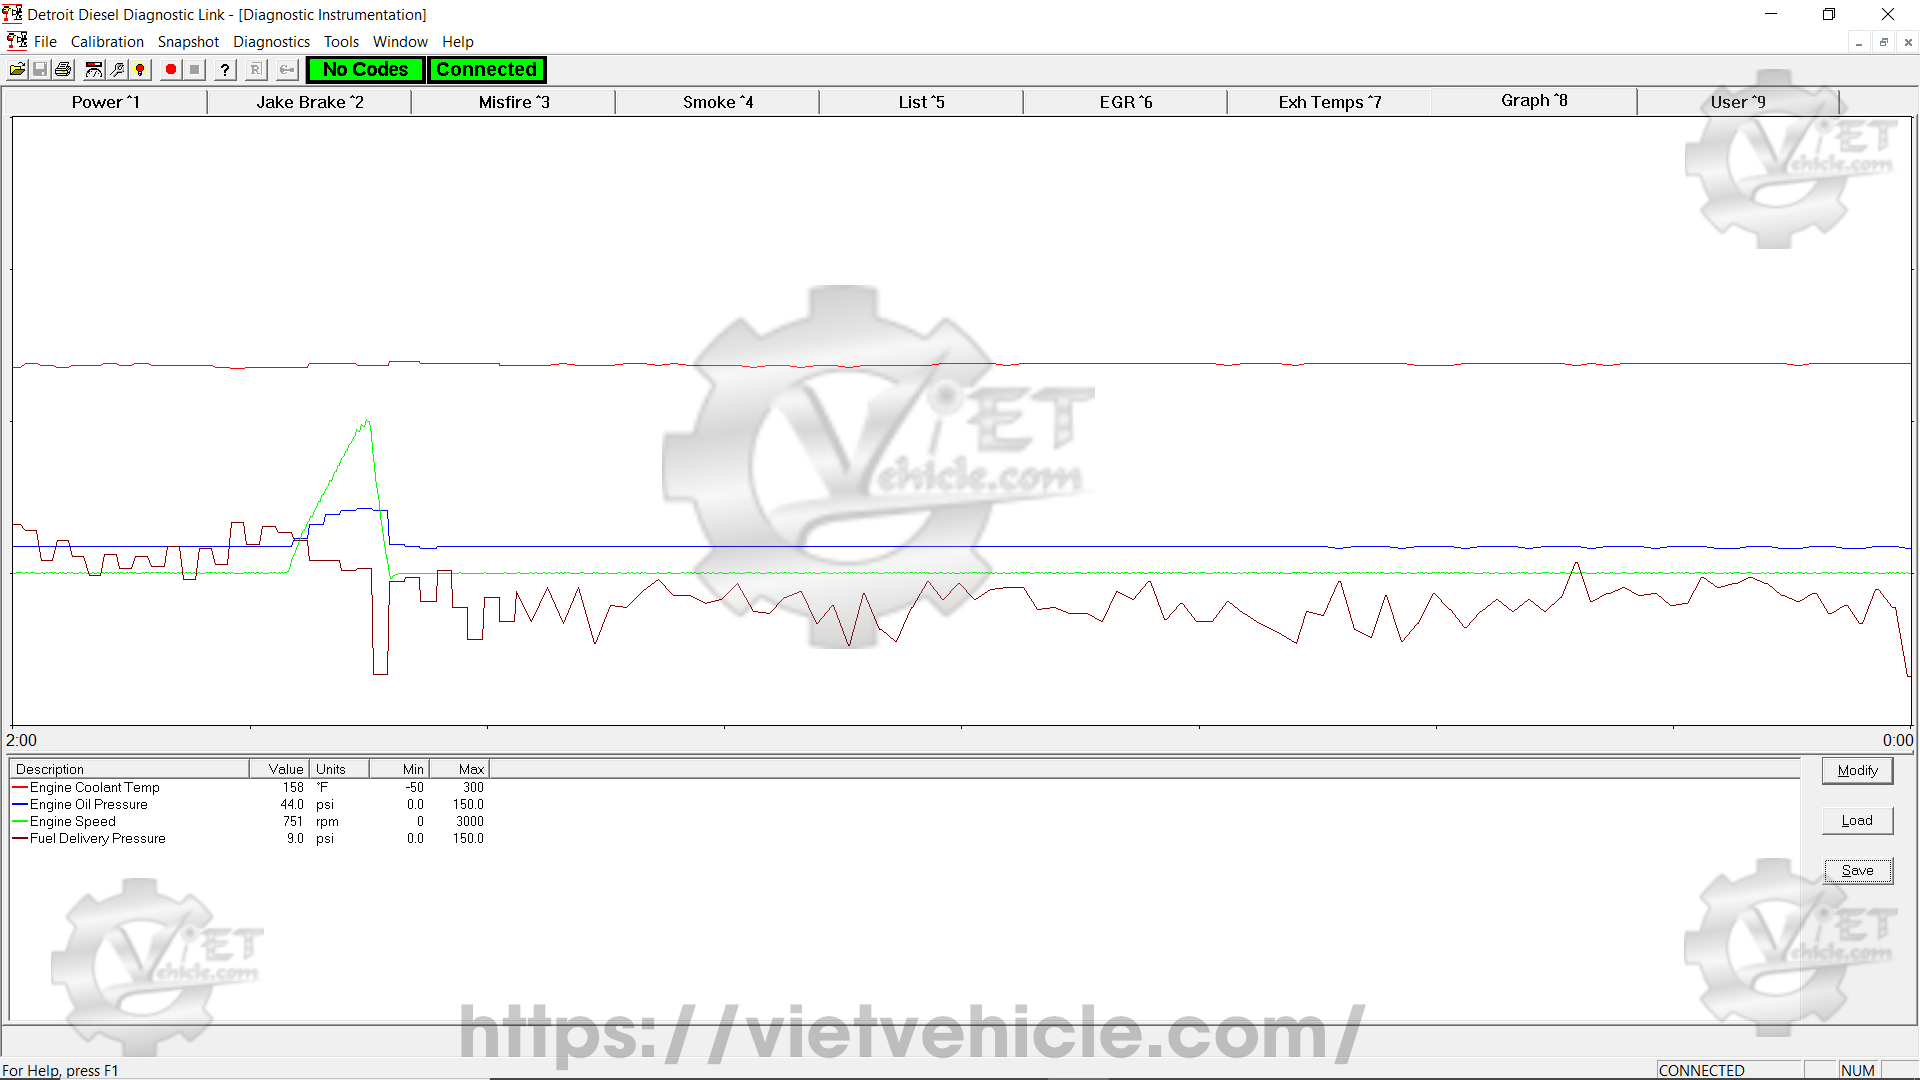
Figure 1.8 – Graph (Diagnostic Instrumentation)
Contact Us
Whatsapp: +84.858.966.333
Facebook: VIETVehicle Remote Delete Service
YouTube: VIETVehicle – ECM Delete Tuning
Tiktok: VIETVehicle.com
Website: VIETVehicle.com

